Even after waiting for hours, the share usage doesn’t change.
The TimeMachine backup is 587 G if I do a “du” on the command line. Still showing 0 Bytes used in the Web UI.
[root@rockstor mnt2]# du -hs TimeMachine/
587G    TimeMachine/
[root@rockstor mnt2]#
Usage of the “root” share is also wrong in the WebUI. Maybe it’s easier to reinstall. What do you think?
Hello, I’m on 3.8-12.08 - just updated today and I’m seeing the same issue. My shares shows the right info, but my Pool shows nothing as being stored there.
I’ve had this issue ever since I’ve been running Rockstor as well (at least 6 month’s, possibly longer). Am running stable at the moment. Currently got 12 drives, each 4TB, setup in raid6.
I’m running RAID 1 and I have the same issue. Rockstor Dashboard shows zero usage on a share that has over 1TB of data in it. I don’t know what the problem is. It makes it difficult for me to tell when to add new drives to the array, I have to really keep track. I’m running the most current build, not using stable updates yet.
Some of the problems in this thread are unfortunately inherent to the use of btrfs. For example, output from the system commands df and du will generally be different from that of btrfsprogs btrfs filesystem df/du. The reason is that filesystem metadata, RAID levels and subvolumes all make the concept of “free space” much more complicated, also depending on whether you look at a whole filesystem or an individual share. The developers themselves explain this better in their FAQ section.
There is another issue with “zero usage” showing after making changes to a btrfs pool; this particular one can be resolved by performing btrfs quota rescan /path/to/pool.
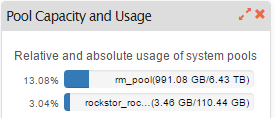
At the moment, the usage reported for pools should be the most accurate. I’ve started an attempt to get a bit more sense into the share usage as well, with some changes to the shares list view in the most recent (3.8-14.10) version. Notably though, I haven’t touched the dashboard view yet. I’m keeping a list of current problems in this github issue:
Good enough! As long as there is somewhere I can find information about my space remaining, I’ll be able to get by. Share data doesn’t matter that much because there is no share size enforcement anyhow, so all I need to know is when to add more drives.
Is there any way to get the correctly reported size from the Pool page to show in the dashboard? That would be super helpful, even if it is only a temporary solution.
That’s a good idea and shouldn’t be too hard, I’ll look into it.
Actually it should be possible to implement a finer grained size enforcement by making each share a subvolume and using btrfs’s quota groups, but that would require some more work.
Well, I think several parts of the dashboard could do with some touch-ups; I just copy/pasted this thing together quickly to provide at least something. I’m currently looking at a suggestion from another user to do the dashboard in Patternfly. If that’s going to work, all widgets will have to be rewritten anyway.
Hi @sfranzen, can I assume you won’t move to Patternfly in the short time??
I think it can be quite easy (Patternfly made over Bootstrap, already running on Rockstor), but meanwhile I’m working on Dashboard widgets and this
Current dashboard crashes are because of D3.js library (not the library itself, but our use of it with 1 sec dynamic data updates on graphs) so I’m having some tests to move from d3.js SVG to chart.js canvas ( Nice post about SVG vs canvas & performance )
To check it, try this : https://jsfiddle.net/u5aanta8/29/ ( a little jsfiddle I’ve done to emulate Rockstor graphs, you can leave it open a long time without performance issues )
There is also an outstanding dashboard patch / enhancement by way of this pr:
Not sure if it’s really relevant if re-writes were planned but popping in here just in case.
I submitted it to partially repair some aesthetics I broke on a previous pr, some discussion in there also.
The approach there is a little fragile still, especially with long serial numbers, so might be best if that whole widget was re-thought anyway, ie only shows top 3 or 5 after patch depending on current widget size anyway.
@Flyer Name dropping you as I know you are already aware of this pr and as you indicate working in this area.
I know that the dashboard ‘as is’ takes a larger amount of client CPU than I would have thought necessary but I’m pretty green on js / web programming so might be a red herring.
@Flyer Yeah I won’t be in a hurry . I personally haven’t had this issue, but I did see there is a lot of hand-crafted SVG stuff in there. Glad there is a better method.
@phillxnet Well so am I . My experience is mostly in C++/Qt as far as UIs go, but I thought I’d use rockstor as a tool to learn more about this.
@suman
even with the latest 3.9.0 release it seems that the data usage issue is still not solved (?)
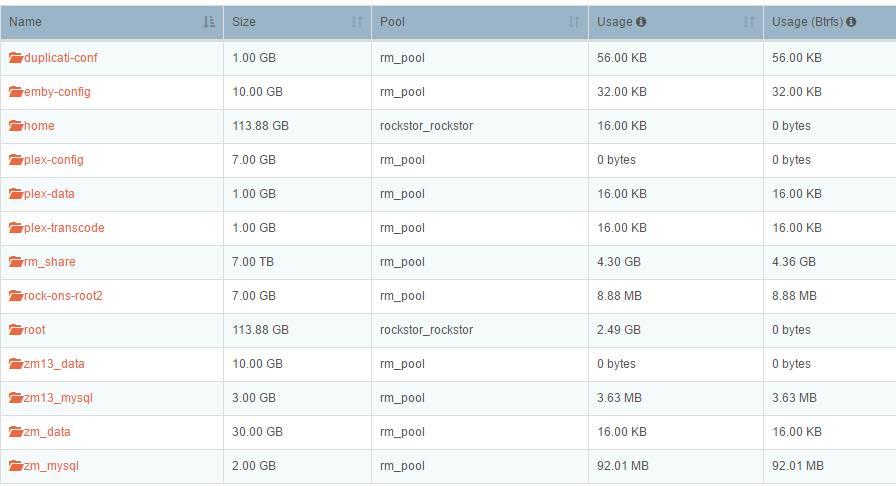
Almost all of belows indicated data usage is wrong (to less of MB/GB)
Hi Roland,
looking your screenshots there’s something I don’t understand :
rm_share has 4.30GB data + 4.36 GB for btrfs “overhead” so you should have a different top shares chart (overhead = light blue and current “real data” 4.30 GB dark blu)
Uhmm…did you update to latest Rockstor right now?? We had usage/btrfs usage on a previous code update and it seems ok

 . I personally haven’t had this issue, but I did see there is a lot of hand-crafted SVG stuff in there. Glad there is a better method.
 . My experience is mostly in C++/Qt as far as UIs go, but I thought I’d use rockstor as a tool to learn more about this.
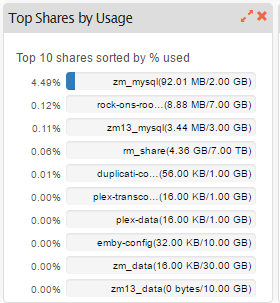
 :
: