CPU Temps and Server Case Fans Speed Monitors

Hello,

New Rockstor user. Just finished setting up 1st Rocktor SMB for a SOHO operation. System:

Dell PowerEdge 2950 III (2U)

  • Dual, Quad Core Xeon E5420 Processor, 2.5GHz
  • 32GB DDR2, Buffered RAM
  • Dell Remote Access Card (DRAC5 Controller)
  • 6/i PERC (Raid Controller)
  • 1x2TB SAS and 5x2TB SATA 3.5" HardDrives
  • 2x1GB NICs
  • 1 DVD-R/W
  • 2x670W Hot-Plug Power Supplies

Feature Requests

  1. What I am curious about, is a feature to monitor the CPU temps, remotely. Preferably, I would like to see the status on the CPU Widget, located on the Dashboard. Is something like feasible? (Or, is it already there, and I not finding it?)

  2. Another feature I would like to see added would be a case fan speeds monitor, if that is possible. The PE 2950 has 4 case fans to keep it cool.

I know some software offers that capability, but not sure if CentOS7, has that feature, which could be built on.

If feasible, but, because of size limitations, then maybe a system Widget, with both those features added.

Thanks in Advance

Hi @azteech,

It turns out I recently submitted a pull request for a Rockon allowing to run the Netdata monitoring tool, which in my opinion would answer both of your feature requests (and much more if interested).
https://github.com/rockstor/rockon-registry/pull/157

As a wrapper for Docker containers, the Netdata Rockon would run as a web app, which means you can configure remote access to it (either via a reverse proxy–for which we also have a Rockon–or any other way you prefer).

While Netdata does not offer fans speed monitoring out of the box, it supports a variety of plugins that can bring this to your system if configured properly. Have a look at the link below if you’re interested:
https://github.com/firehol/netdata/blob/master/charts.d/README.md#sensors

Note, that this Rockon has not been merged in the offical Rockon repository yet, so you will need to install it locally if you’d like to test it. Detailed instructions are here:

Hope this helps,

2 Likes

@Flox,
this is pretty awesome. I tested your json locally, and you’re right, it gives you an amazing amount of details out of the box (I’d even say, information overload :)). If and when a compressed widget becomes available like @azteech suggested (which I think would be great, too), this is a nice monitoring setup.

Thanks for pointing out this monitoring app.

Daniel

Thanks @Hooverdan and @azteech,

This thread made me realize the json file I originally submitted did not allow for easy loading of custom configuration files. I corrected this in a new commit.

@Flox Your netdata Rock-on works a treat, well done.

Just been playing with it: post override volume addition. Netdata is really nice. Also as we need more people to test pending Rock-on pull requests I’ve done the following wiki entry using your pending Rock-on pull request as an example:

@azteech and @Hooverdan
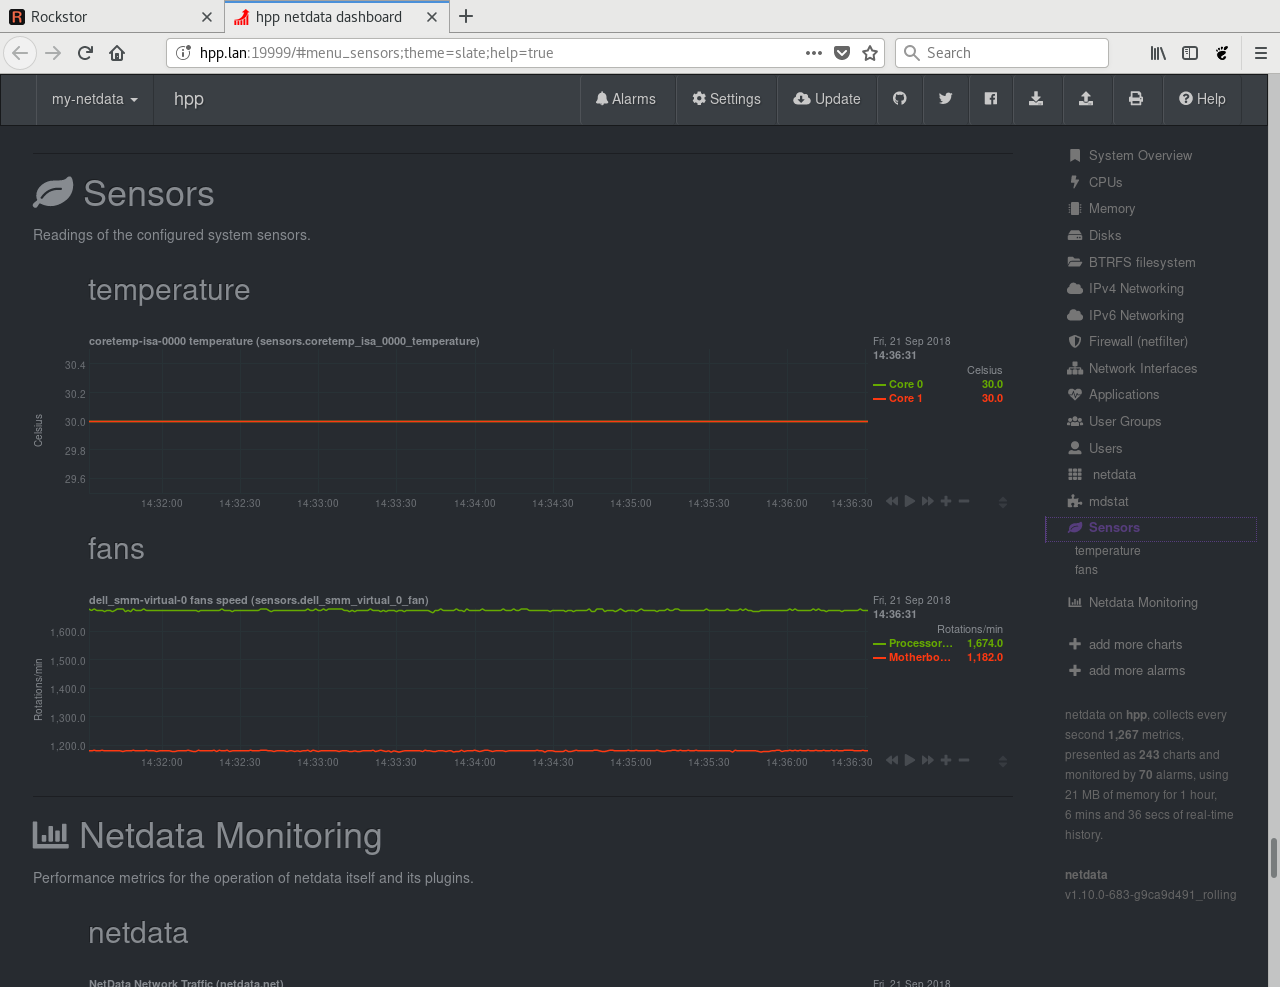
It managed to read an old Dell Machines CPU temp and FAN speed just dandy here (no additional config):

@Flox I’ve commented on your pr. Thanks for getting this one done. Much appreciated.

1 Like

@Flox,

Thank you for the response; and pointing out your netdata.json Rock-on. Using phillxnet’s write-up for installing proposed Rock-ons, I was able to get it successfully installed on the PE2950 III, with no problems.

However, in running it, and reviewing the netdata.conf file (https://ipaddress:19999/netdata.conf or https://hostname:19999/netdata.conf), found out the ipmi plug-in, “freeipmi.plugin” is not setup, nor installed. In current status, fan monitoring is not available. According to netdata wiki (https://github.com/netdata/netdata/wiki/Add-more-charts-to-netdata#sensors), the latest sensors plug-in is python-based.

I checked Rockstor installation, and ipmiutility is installed by default. Ran ‘ipmimonitoring’ from cli, and it is functioning, and does pick-up the fans; therefore, do have a secondary route to check fan speed and fan status.

I do not see a way to add a plug-in from within the netdata app. Therefore, suspect to add the “freeipmi.plug-in” would entail a new github pull-request for your proposed rock-on, the plug-in configured, and new .json file would have to be generated. Am I correct in my understanding of the process?

Again, Thank You for pointing out your proposed Rock-on. I believe it will be a welcome addition to the project. Great job.

@philxnet

A big Thank You, to you as well, for the wiki write up for installing a proposed Rock-on. It was spot on, and allowed for flawless installation of the proposed Rock-on, netdata.

Hi @azteech,
I’m glad you could install this Rockon without a problem, the wiki entry is indeed very nice to follow. Let’s try and see if I can help with your fans speed not showing up.

First things first, it is important to know that Rockstor’s Rock-ons are wrapper for Docker containers, and as a results their environment is isolated from Rockstor’s system to a certain extent. In practice, this means that a software package installed on Rockstor’s system will not be seen–and thus accessible–by a container (Rock-on in our case). This means that even if a plugin is installed on Rockstor’s system, it won’t be accessible by the container. In your case, the Netdata Rock-on wouldn’t be able to see software installed on Rockstor’s system (I’m generalizing a lot but that’s the general concept).

Based on my previous paragraph, this means that we need to see what are the sensors and related monitoring plugins that the Netdata Rock-on–and not Rockstor’s system–can see. Fortunately, Docker offers an easy way to work from within a container: docker exec (documentation).
For instance, from the Rockstor’s shell, you can see we are indeed running Rockstor:

[root@rockstor ~]# cat /etc/*-release
NAME="Rockstor"
VERSION="3 (Core)"
ID="rockstor"
ID_LIKE="rhel fedora"
VERSION_ID="3"
PRETTY_NAME="Rockstor 3 (Core)"
ANSI_COLOR="0;31"
CPE_NAME="cpe:/o:rockstor:rockstor:3"
HOME_URL="https://www.rockstor.com/"
BUG_REPORT_URL="https://www.rockstor.com/"

Rockstor release 3.9.23 (Core)
[root@rockstor ~]#

Now, if you open a bash shell on the Netdata Rock-on (docker container):

[root@rockstor ~]#
[root@rockstor ~]# docker exec -it netdata bash
root@rockstor:/#
root@rockstor:/# cat /etc/*-release
PRETTY_NAME="Debian GNU/Linux 9 (stretch)"
NAME="Debian GNU/Linux"
VERSION_ID="9"
VERSION="9 (stretch)"
ID=debian
HOME_URL="https://www.debian.org/"
SUPPORT_URL="https://www.debian.org/support"
BUG_REPORT_URL="https://bugs.debian.org/"
root@rockstor:/#
root@rockstor:/# exit #CTRL + D to exit
[root@rockstor ~]#
[root@rockstor ~]#

You can see we are now seeing Debian as the OS, which is the distribution on which the Netdata docker container is based.

Now, to come back to your problem, we need to see what are the sensors that Netdata can see from within the container.

  1. You already checked the http://ipaddress:19999/netdata.conf file, which summarises what netdata can see, which is a very good starting point. Do you see any [sensors.xxxxx] section (xxxxx being specific to the hardware)?

  2. You can also see what the Netdata container can see by running the following from the Rockstor shell:

[root@rockstor ~]# docker exec -it netdata sensors

This calls the sensors function that will list all the sensors that the Netdata container can see. If your fans are not on the list, for instance, this may highlight some hardware incompatibility. This is my case, for instance, as I can see CPU-temp related data, but nothing related to fans:

[root@rockstor ~]# docker exec -it netdata sensors
fam15h_power-pci-00c4
Adapter: PCI adapter
power1:           N/A  (crit =  25.00 W)

radeon-pci-0008
Adapter: PCI adapter
temp1:        +18.0 C  (crit = +120.0 C, hyst = +90.0 C)

k10temp-pci-00c3
Adapter: PCI adapter
temp1:        +13.5 C  (high = +70.0 C)
                       (crit = +70.0 C, hyst = +69.0 C)

[root@rockstor ~]#

We can proceed further based on the output of the docker exec -it netdata sensors. For instance, if you see fan-related sensors there, then it underlines some configuration issue of the sensors plugins in Netdata. If you do cannot see anything related to your fans there, then it may prove more difficult to see them there. Maybe trying the old bash-based charts.d plugin would be worth a try but I’m not sure.
Let’s see what your docker exec -it netdata sensors outputs and how it compares to your htttp://ipaddress:19999/netdata.conf.

Hope this helps,

1 Like

@Flox,

Thank you for your response. In reviewing my earlier response, I determined it to be incorrect in identification of the problem. My bad, and apologies. For sake of clarity, and keep pollution out of this discussion of your proposed, I will correct my original response.

To answer your questions:

  1. You already checked the http://ipaddress:19999/netdata.conf file, which summarises what netdata can see, which is a very good starting point. Do you see any [sensors.xxxxx] section ( xxxxx being specific to the hardware)?

When referring to sensors is not loaded, I was refering to the “freeipmi.plug-in” not being installed (https://github.com/netdata/netdata/wiki/monitoring-IPMI). This is the plug-in that monitors the fans, according to the Sensors section of the following: https://github.com/netdata/netdata/wiki/Add-more-charts-to-netdata#sensors

The actual sensors plug in, is installed. I do a search of the .conf file, I find numerous references to sensors in the output of https://hostname:19999/netdata.conf.

When I do similar search, for “ipmi”, “fan”, or “plugin:ipmi” none of those are found within.

This leads me to believe the freeipmi plug.in (https://github.com/netdata/netdata/wiki/monitoring-IPMI) is not installed.

  1. You can also see what the Netdata container can see by running the following from the Rockstor shell:

When I check docker for the sensors it is checking for, I get:

[root@rocknas1 XXXX]# docker exec -it netdata sensors
coretemp-isa-0001
Adapter: ISA adapter
Core 0: +57.0 C (high = +84.0 C, crit = +100.0 C)
Core 1: +51.0 C (high = +84.0 C, crit = +100.0 C)
Core 2: +50.0 C (high = +84.0 C, crit = +100.0 C)
Core 3: +50.0 C (high = +84.0 C, crit = +100.0 C)

i5k_amb-isa-0000
Adapter: ISA adapter
Ch. 0 DIMM 0: +85.5 C (low = +105.0 C, high = +124.0 C)
Ch. 0 DIMM 1: +75.5 C (low = +105.0 C, high = +120.0 C)
Ch. 1 DIMM 0: +90.0 C (low = +105.0 C, high = +124.0 C)
Ch. 1 DIMM 1: +73.0 C (low = +105.0 C, high = +120.0 C)
Ch. 2 DIMM 0: +81.5 C (low = +105.0 C, high = +120.0 C)
Ch. 2 DIMM 1: +76.5 C (low = +105.0 C, high = +120.0 C)
Ch. 3 DIMM 0: +86.5 C (low = +105.0 C, high = +120.0 C)
Ch. 3 DIMM 1: +78.0 C (low = +105.0 C, high = +120.0 C)

coretemp-isa-0000
Adapter: ISA adapter
Core 0: +49.0 C (high = +84.0 C, crit = +100.0 C)
Core 1: +48.0 C (high = +84.0 C, crit = +100.0 C)
Core 2: +51.0 C (high = +84.0 C, crit = +100.0 C)
Core 3: +48.0 C (high = +84.0 C, crit = +100.0 C)

If I run: ipmimonitoring from the Rockstor shell cli, I see fan speed monitoring is already being done.

[root@rocknas1 admin]# ipmimonitoring
ID | Name | Type | State | Reading | Units | Event
5 | Ambient Temp | Temperature | Nominal | 29.00 | C | ‘OK’
6 | CMOS Battery | Battery | Nominal | N/A | N/A | ‘OK’
7 | ROMB Battery | Battery | Warning | N/A | N/A | ‘OK’
8 | VCORE | Voltage | Nominal | N/A | N/A | ‘State Deasserted’
9 | VCORE | Voltage | Nominal | N/A | N/A | ‘State Deasserted’
10 | CPU VTT | Voltage | Nominal | N/A | N/A | ‘State Deasserted’
11 | 1.5V PG | Voltage | Nominal | N/A | N/A | ‘State Deasserted’
12 | 1.8V PG | Voltage | Nominal | N/A | N/A | ‘State Deasserted’
13 | 3.3V PG | Voltage | Nominal | N/A | N/A | ‘State Deasserted’
14 | 5V PG | Voltage | Nominal | N/A | N/A | ‘State Deasserted’
15 | 1.5V PXH PG | Voltage | Nominal | N/A | N/A | ‘State Deasserted’
16 | 5V Riser PG | Voltage | Nominal | N/A | N/A | ‘State Deasserted’
17 | Backplane PG | Voltage | Nominal | N/A | N/A | ‘State Deasserted’
18 | Linear PG | Voltage | Nominal | N/A | N/A | ‘State Deasserted’
19 | 0.9V PG | Voltage | Nominal | N/A | N/A | ‘State Deasserted’
20 | 0.9V Over Volt | Voltage | Nominal | N/A | N/A | ‘State Deasserted’
21 | CPU Power Fault | Voltage | Nominal | N/A | N/A | ‘State Deasserted’
22 | FAN 1 RPM | Fan | Nominal | 3000.00 | RPM | ‘OK’
23 | FAN 2 RPM | Fan | Nominal | 2025.00 | RPM | ‘OK’
24 | FAN 3 RPM | Fan | Nominal | 2850.00 | RPM | ‘OK’
25 | FAN 4 RPM | Fan | Nominal | 2475.00 | RPM | ‘OK’
28 | Presence | Entity Presence | Nominal | N/A | N/A | ‘Entity Present’
29 | Presence | Entity Presence | Nominal | N/A | N/A | ‘Entity Present’
30 | Presence | Entity Presence | Nominal | N/A | N/A | ‘Entity Present’
31 | Presence | Entity Presence | Nominal | N/A | N/A | ‘Entity Present’
32 | Presence | Entity Presence | Nominal | N/A | N/A | ‘Entity Present’
33 | Presence | Entity Presence | Nominal | N/A | N/A | ‘Entity Present’
34 | DRAC5 Conn 2 Cbl | Cable/Interconnect | Nominal | N/A | N/A | ‘Cable/Interconnect is connected’
36 | Status | Processor | Nominal | N/A | N/A | ‘Processor Presence detected’
37 | Status | Processor | Nominal | N/A | N/A | ‘Processor Presence detected’
38 | Status | Power Supply | Nominal | N/A | N/A | ‘Presence detected’
39 | Status | Power Supply | Critical | N/A | N/A | ‘Presence detected’
40 | Status | Cable/Interconnect | Nominal | N/A | N/A | ‘Cable/Interconnect is connected’
41 | RAC Status | Module/Board | N/A | N/A | N/A | ‘OK’
42 | OS Watchdog | Watchdog 2 | Nominal | N/A | N/A | ‘OK’
44 | Intrusion | Physical Security | Nominal | N/A | N/A | ‘OK’
45 | PS Redundancy | Power Supply | Critical | N/A | N/A | ‘Fully Redundant’
46 | Fan Redundancy | Fan | Nominal | N/A | N/A | ‘Fully Redundant’
48 | Drive | Drive Slot | Nominal | N/A | N/A | ‘Drive Presence’
49 | Cable SAS A | Cable/Interconnect | Nominal | N/A | N/A | ‘Cable/Interconnect is connected’
50 | Cable SAS B | Cable/Interconnect | Nominal | N/A | N/A | ‘Cable/Interconnect is connected’

So I know the system is capable of providing what I want to see. It really boils down to the freeipmi.plugin not being installed/available, nor listed or enabled in the netdata.conf file, within your proposed Rock-on.

I hope that helps clarify the issue.

Again, thank you for your help.

As you can see on the link you provided (https://github.com/netdata/netdata/wiki/Add-more-charts-to-netdata#sensors), IMPI is only one of the applications that Netdata can use for sensors-related data. The one application that is built-in and supported without need for configuration in the docker image the Rock-on is using the fourth down IPMI in the link you provided:

sensors
(the one based on python, not bash)
Uses lm-sensors to collect sensor data.

netdata plugin: python.d.plugin
plugin module: sensors.chart.py
configuration file: python.d/sensors.conf

As you can see in the configuration file, this plugin can chart the following sensors data if the hardware provides it (fan is one of them):

types:
  - temperature
  - fan
  - voltage
  - current
  - power
  - energy
  - humidity

As you mention, the IPMI monitoring is not supported in this docker container and would need to be installed and activated:

  • either manually by login into the Netdata rockon and installing libipmimonitoring-dev, libipmimonitoring-devel, or freeipmi-devel and then activating the freeipmi plugin in the netdata conf files (as described in the other link you provided).
  • or forking the container image and doing the steps listed above directly into the container.

Neither of these options is a good permanent one so maybe it’s better to try something else first as your hardware doesn’t seem compatible with the python-based sensors plugin. It’s unfortunately not something that I can test myself as I don’t have compatible hardware, but I saw some suggestions about trying the older bash-based sensors plugin. You can give it a try if you’d like. If that is the case, the steps would like something like the following:

  1. copy python.d.conf (here) and charts.d.conf (here) files in your share mounted as netdata-conf during Rock-on install.
  2. in python.d.conf, uncomment the line with sensors and set it to no sensors: no line 84:
  3. in charts.d.conf, uncomment the line with sensors and let it at sensors=force line 56.

Restart the Rock-on and now the sensors part of the charts should be taken care of by the old charts.d plugin instead of the newer python-based. It’s a long shot but maybe that one is more compatible with your hardware.

@Flox

Thanks for the response.

Understand what you are saying about what is suppose to work and be installed right from the start. However, in the case of your proposed Netdata Rock-on, it is not.

This can be seen by looking at the plug-ins as shown in this link: https://github.com/netdata/netdata/wiki/monitoring-IPMI

if I were to look at just the plug-ins.d directory, I get:

[root@rocknas1 admin]# docker exec -it netdata bash
root@rocknas1:/# ls /usr/libexec/netdata/plugins.d
README.md cgroup-name.sh fping.plugin
alarm-email.sh cgroup-network loopsleepms.sh.inc
alarm-notify.sh cgroup-network-helper.sh node.d.plugin
alarm-test.sh charts.d.dryrun-helper.sh python.d.plugin
apps.plugin charts.d.plugin tc-qos-helper.sh

No where does it show the ipmi.plug-in.

If I were to do the listing, as shown in the link above, I get:

root@rocknas1:/# ls /usr/libexec/netdata/plugins.d/freeimpi.plugin -h
ls: cannot access ‘/usr/libexec/netdata/plugins.d/freeimpi.plugin’: No such file or directory

Again, shows that freeipmi.plugin is not installed.

I know that one page says that it is supposed to be there, from the start…but it isn’t.

The second link, https://github.com/netdata/netdata/wiki/monitoring-IPMI, says it needs to be complied in, and configured in the netdata.conf file, for it to function.

Again, if I search (browswer ctrl-f) within the netdata.conf file, for plugin:ipmi, I get nada. If I do same search for just plugin:, I get 119 hits. Looking through all the hits, again ipmi is not listed. So once again, I say that something is wrong – either the web page, saying it is suppose to work out of the box, or the freeipmi.plugin has been deconfigured/removed, from the .json file you did a pull request from. Either way, it is not there.

If it is the 1st problem, then maybe the config just needs to be added back into netdata.conf. Or, the plugin needs to be downloaded, and netdata needs to be recompiled with it in, and then submitted, after doing such.
Or, it is a bug that needs to be corrected at the upstream level. In that case, a bug report would need be done. In this case, since it is your proposed Rock-on, I assume you would be the upstream (and in turn, you would have to file the report with your upstream source.)

If I can figure out how to get in and edit the netdata.conf file, in your proposed, and add the config portion as listed in `freeipmi.plugin configuration’ on https://github.com/netdata/netdata/wiki/monitoring-IPMI, then I could determine what the issue is. But, thus far, not able to figure out how to get into the netdate.conf. Just know how to list it, from within the browser.

Also, as for testing the availability of the ipmi functioning, you say you can’t test because you do not have the same board as I. I say, that if you run ‘ipmimonitoring’ from the Rockstor shell CLI, and look at the output, you probably will find that fans are already being monitored. If that is the case, you don’t have to have the same board as I, and therefore the functionality can be tested.
If ipmimonitoring output does not list fans, then I would say your statement would be correct.

Also, being able to do ipmimonitoring would also show that the required library, libipmimonitoring-dev or libipmimonitoring-devel (freeipmi-devel on RHEL based OS), was already installed (which is the case of Rockstor, out-of-the-box, or, as direct result of installing your proposed netdata app).

I know what I am wanting to do maybe a one off configuration. However, because the case fans have been modified (to get rid of the jet engine noise level, as server/NAS is installed in the home office). However, because of the heat factor from Arizona temps, it is important I keep an eye on memory/cpu temps and fan speeds for the NAS/server appliance, remotely.

As I previously stated, there is a work around for the lack of Netdata fan speed monitoring - e.g. doing the ipmimonitoring command from the NAS CLI - until such time as Netdata obtains the functionality, or I can find another solution (such as a widget for the ipmi fan data).

Once again, thanks for the additional input. Still say your proposed is a viable, and needed, Rock-on, for those not needing the fan speed readout(s).

@azteech

Remember that @Flox’s proposed Rock-on definition file is, as per all Rock-ons, a wrapper that ‘makes nice’ the install of docker images. And in this case the image @Flox is using can be found in the json file here:

And if we search for that image on Docker Hub we get to (180 stars 10M pulls):

https://hub.docker.com/r/titpetric/netdata/

which in turn details some of the issues with including all available plugins:

"Additional notes

Netdata provides monitoring via a plugin architecture. This plugin supports many projects that don’t provide data over the /proc filesystem. When you’re running netdata in the container, you will have difficulty providing many of these paths to the netdata container."

They then go on to explain the procedure where by one can extend their container to include stuff that might be wanted. That’s a possible route but entails having then to maintain that container, which is both the strength (sharing effort) and potential weakness around the current docker approach to ‘supplying’ appliances.

Hope that helps by way of chipping in for context. And well done for narrowing down the problem here, ie resourced container appears not to have required plugin. But that may be because such a plugin doesn’t function within a container environment. Definitely worth a try though and if you do end up extending titpetric very popular netdata docker image (definition) then do let us know how that goes. Also you could try opening an issue with your findings re the ‘missing’ ipmi plugin at their GitHub page for this netdata dockerfile project.

I was able to get hdd temperatures from @Flox’s proposed Rock-on by the following method:

Install the hddtemp program in Rockstor:

yum install hddtemp

Then if I run it in ‘deamon’ mode (from ‘man hddtemp’):

      -d, --daemon
              Execute hddtemp in TCP/IP daemon mode (port 7634 by default).

and given the included, on this occasion, hddtemp plugin config default is to look at localhost 7634 and @Flox has added a “–net=host” option to running the sighted container, the containerised netdata can access the host run and installed hddtemp output via it’s network privilege:

I’m afraid I don’t know anything about the ipmi plugin or how it can make available the data that it gathers.

Notice in a past post of mine in this thread I was able to retrieve fan speed from an older dell via the netdata Rock-on, presumably because they were ‘surfaced’ within the /proc filesystem or something.

Although I didn’t get the same luck on a couple of other Dells I tried.

Hope that helps at least for context.