Painfully slow rebalance/RAID conversion

Processor is an i3-6100.

I previously had:

  • RAID 1
  • 8 TB x 2
  • 6 TB x 2
  • 2 TB x 4
  • 14 TB of data

A 2 TB drive failed, so I removed 2 of them from the pool. This took about a week. I purchased two new 8 TB drives and put them in last weekend. I’ve added them to the pool and am changing the pool to RAID 6.

btrfs balance status /mnt2/main_pool indicates that the rebalance has 73% to go, so about 3 more weeks.

Is it normal for it to take this long? Plex is almost unusable right now, it’ll play for 2 to 3 minutes then pause for 5 seconds or so. The kids and wife aren’t happy. I’m getting by with copying everything to a laptop and playing it from there.

Down the road, I plan on removing the other two 2 TB drives and replacing them as well. So long as I don’t change the RAID level, it should go more quickly right?

@Noggin Hello again.

Pretty much yes, especially the raid 5/6 variants can be extra slow. Also note that the btrfs parity raid levels of 5 and 6 are not generally recommended for production use. Though I expect you know this already.

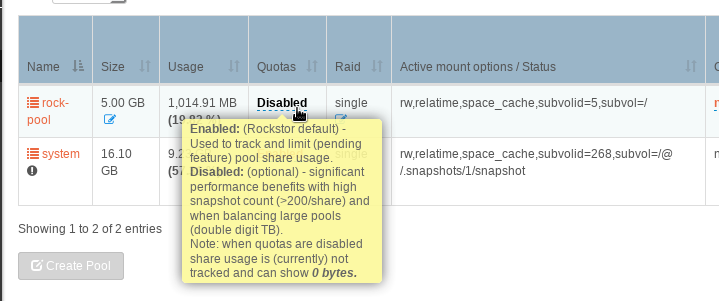
The main slow down in almost all cases is quotas and if you are running any more recent stable subscription you can disable quotas. But all our current testing variants (now older) will suffer Web-UI breakage if quotas are disabled. Quotas disabled state will remove the ability to see finer grained usage but should fairly massively speed up such processes as balance for example. It will also significantly improve the interactivity of the system as it will have far far less to calculate and so will be more available for other tasks. This is a know area of weakness for btrfs and has recently received a few significant improvements so we should get those going forward.

and also available in the pool details page:
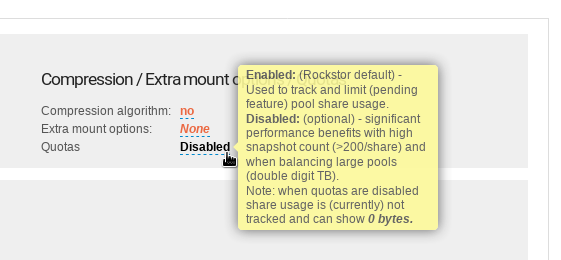
quota-setting-in-pool-detail-page

Note that you can also disable quotas via the command line and the Web-UI should reflect this, (if stable channel) and after an web page refresh, as the canonical reference is the pool itself. Although the Web-UI may take a while to respond if the system is super busy such as it tends to be in these circumstances.

There are also performance improvements on the Rockstor side that help with interactivity in such settings that are due to land in 3.9.2-49. But quotas enabled is the main cause here usually.

Hope that helps and let us know how it goes.
1 Like

Thanks Phil. I’ve disabled quotas and will check the percentage in a couple more days. Server uptime is 7 days and a couple of hours, so it’s been going at roughly 4% per 24 hours. I’ll try Plex again too now that quotas are turned off.

And yes, I’m aware that RAID5/6 isn’t for production usage. I’m on a UPS and the system will shut down gracefully after a couple of minutes without power so I think that covers the worst of the issues. I have local and offsite backup, so it’s only time that I’ll lose at worst. Thank you for the reminder though!

Edit: It seems to be going much faster. I’ll try to remember to report back in when it is done and report how long it takes.

With quotas on, it took 7 days to do 27%. After turning quotas off, it finished in 3 days.

Anyway, something doesn’t look quite right. btrfs fi show indicates the following:

Tue Apr 9 18:15:36 2019

Label: ‘rockstor_rockstor’ uuid: 5c2b67f2-9f3a-4e52-b979-32e9dc159423
Total devices 1 FS bytes used 4.61GiB
devid 1 size 51.57GiB used 9.04GiB path /dev/sdi3

Label: ‘main_pool’ uuid: 07f188d4-44d6-49fd-86ac-0380734fe1d2
Total devices 8 FS bytes used 12.08TiB
devid 2 size 1.82TiB used 1.82TiB path /dev/sdg
devid 5 size 1.82TiB used 1.82TiB path /dev/sde
devid 7 size 5.46TiB used 5.46TiB path /dev/sdh
devid 8 size 5.46TiB used 5.46TiB path /dev/sdf
devid 9 size 7.28TiB used 4.42TiB path /dev/sdc
devid 10 size 7.28TiB used 4.42TiB path /dev/sdd
devid 11 size 7.28TiB used 7.28TiB path /dev/sdb
devid 12 size 7.28TiB used 7.28TiB path /dev/sda

It looks like all of the drives are full, except for 9 and 10. The dashboard indicates that I have 12 TB used and 17 TB free. Should I ignore the btrfs fi show output?

Edit: Maybe it is a non-issue. Over the last few minutes, the disk usage has gone down. Perhaps it is just cleaning up from the RAID conversion.

Edit2: Looks like everything is OK. Here’s the usage as of this morning:

Label: ‘main_pool’ uuid: 07f188d4-44d6-49fd-86ac-0380734fe1d2
Total devices 8 FS bytes used 12.08TiB
devid 2 size 1.82TiB used 1.82TiB path /dev/sdg
devid 5 size 1.82TiB used 1.82TiB path /dev/sde
devid 7 size 5.46TiB used 2.13TiB path /dev/sdh
devid 8 size 5.46TiB used 2.12TiB path /dev/sdf
devid 9 size 7.28TiB used 2.13TiB path /dev/sdc
devid 10 size 7.28TiB used 2.13TiB path /dev/sdd
devid 11 size 7.28TiB used 2.78TiB path /dev/sdb
devid 12 size 7.28TiB used 2.78TiB path /dev/sda

@Noggin Thanks for the update and glad it worked out in the end:

quotas on performance is under much scrutiny / development by the btrfs folks and there are a few fairly significant improvements in the pipelines. Hopefully we will run into these sooner rather than later.

Yes that looks a little happier. During balance the figures can look pretty strange as some space is used for the operation itself. Also note that what you are looking at is allocated space, and not actual usage from data (even though in btrfs fi show is states usage confusingly). Btrfs first allocates chunks (shown by fi show), which have individual raid profiles and sizes each of mostly 1GB. Chunks are created/allocated on an as needed basis. These chunks are then populated by much smaller ‘blocks’ which inherit their parent chunks raid levels. So in a balance that involves a raid change there is quite a to-do list with all the shuffling required to create the new raid level chunks and move the associated blocks from their old raid level chunks to their new ones. I’ve probably butcher that but it may help.

Anyway, as to the fi show ‘usage’ which is actually allocation (of chunks) see the following command and you may note another reason why raid5/6 is not recommended just yet:

btrfs fi usage /mnt2/main_pool

This will show both allocated (fi show ‘usage’) and it’s own ‘Used’ variant which I’m pretty sure pertains to the sum of blocks within chunks.

You can also examine a single drive independently with that command. Rockstor uses that command internally as well as in combination with fi show and some subvol bits and bobs.

We have a pending pull request of mine that @Flox has kindly functionally reviewed that surfaces the per disk allocation that you were watching in your btrfs fi show reports during this balance as it’s often a useful indicator. It also adds btrfs dev ids in the same pool details ‘Disks’ table. See the pics of the testing done prior to submitting that pull request that’s also the fix for the error you ran into in a previous forum thread re Web-UI leaving us high and dry on disk removals (read falling on it’s face):

As part of that fix I had to add better internal monitoring so though I’d surface it as well. Due to be released as 3.9.2-49 once I’m done with a back-end support project for stable subscribers; if all goes to plan that is :slight_smile:.

Would be interesting to have the above fi usage output pasted here also if you fancy?

Thanks for the updates and glad your conversion seems to have worked out. What make/model of UPS are you using by the way and do you have it directly connect to the Rockstor machine? I use a Riello Sentinel Pro 1000 (SEP 1000) 1000VA / 800W. The NUT driver needs some work, last I looked, but I’ll try and chip in there if I ever get that amount of time. Maybe once our transition to openSUSE has calmed down.

1 Like

btrfs fi show /mnt2/main_pool shows

Label: ‘main_pool’ uuid: 07f188d4-44d6-49fd-86ac-0380734fe1d2
Total devices 8 FS bytes used 12.09TiB
devid 2 size 1.82TiB used 1.82TiB path /dev/sdg
devid 5 size 1.82TiB used 1.82TiB path /dev/sde
devid 7 size 5.46TiB used 2.13TiB path /dev/sdh
devid 8 size 5.46TiB used 2.13TiB path /dev/sdf
devid 9 size 7.28TiB used 2.13TiB path /dev/sdc
devid 10 size 7.28TiB used 2.13TiB path /dev/sdd
devid 11 size 7.28TiB used 2.78TiB path /dev/sdb
devid 12 size 7.28TiB used 2.78TiB path /dev/sda

The UPS I have is a CyberPower 1325VA. I don’t recall having to do anything special to get it working. I used to get emails every week or two about power fluctuations so I’m assuming that it is working well.
However, I haven’t bothered to set up email since I reinstalled Rockstor a while back. I need to get on that.

Edit: You asked for usage, not show

btrfs fi usage /mnt2/main_pool
WARNING: RAID56 detected, not implemented
Overall:
Device size: 43.66TiB
Device allocated: 6.06GiB
Device unallocated: 43.66TiB
Device missing: 0.00B
Used: 331.44MiB
Free (estimated): 0.00B (min: 8.00EiB)
Data ratio: 0.00
Metadata ratio: 0.30
Global reserve: 512.00MiB (used: 0.00B)

Data,RAID6: Size:12.13TiB, Used:12.07TiB
/dev/sda 2.78TiB
/dev/sdb 2.78TiB
/dev/sdc 2.12TiB
/dev/sdd 2.12TiB
/dev/sde 1.82TiB
/dev/sdf 2.12TiB
/dev/sdg 1.82TiB
/dev/sdh 2.12TiB

Metadata,RAID1: Size:3.00GiB, Used:164.83MiB
/dev/sdc 3.00GiB
/dev/sdd 3.00GiB

Metadata,RAID6: Size:17.09GiB, Used:15.00GiB
/dev/sda 4.85GiB
/dev/sdb 4.85GiB
/dev/sdc 4.10GiB
/dev/sdd 4.10GiB
/dev/sde 612.31MiB
/dev/sdf 3.85GiB
/dev/sdg 612.31MiB
/dev/sdh 3.85GiB

System,RAID1: Size:32.00MiB, Used:912.00KiB
/dev/sdc 32.00MiB
/dev/sdd 32.00MiB

Unallocated:
/dev/sda 4.50TiB
/dev/sdb 4.50TiB
/dev/sdc 5.15TiB
/dev/sdd 5.15TiB
/dev/sde 1.17GiB
/dev/sdf 3.33TiB
/dev/sdg 1.17GiB
/dev/sdh 3.33TiB