Btrfs commands use 100% cpu and other issues

For a while now my rock-ons where broken, but I didn’t have time to investigate. Additionally, updates seemed to have failed, and I was stuck on 4.0.7 for a while.

I finally found some time and thought the first thing is to do the update as it maybe magically fixes all other problems. No game.
I managed to get it to update to 4.0.9 using SSH and the zypper refresh && zypper up command. That worked.
But here are the issues:

  • The web ui is generally very slow, with usually at least 10 seconds for any page, but often more than 50 seconds (this problem existed before the update as well)

  • The rock-ons services can’t be started anymore, the https call times out after 2 minutes and I get an empty error message, the browser debug says the server returned a 504.

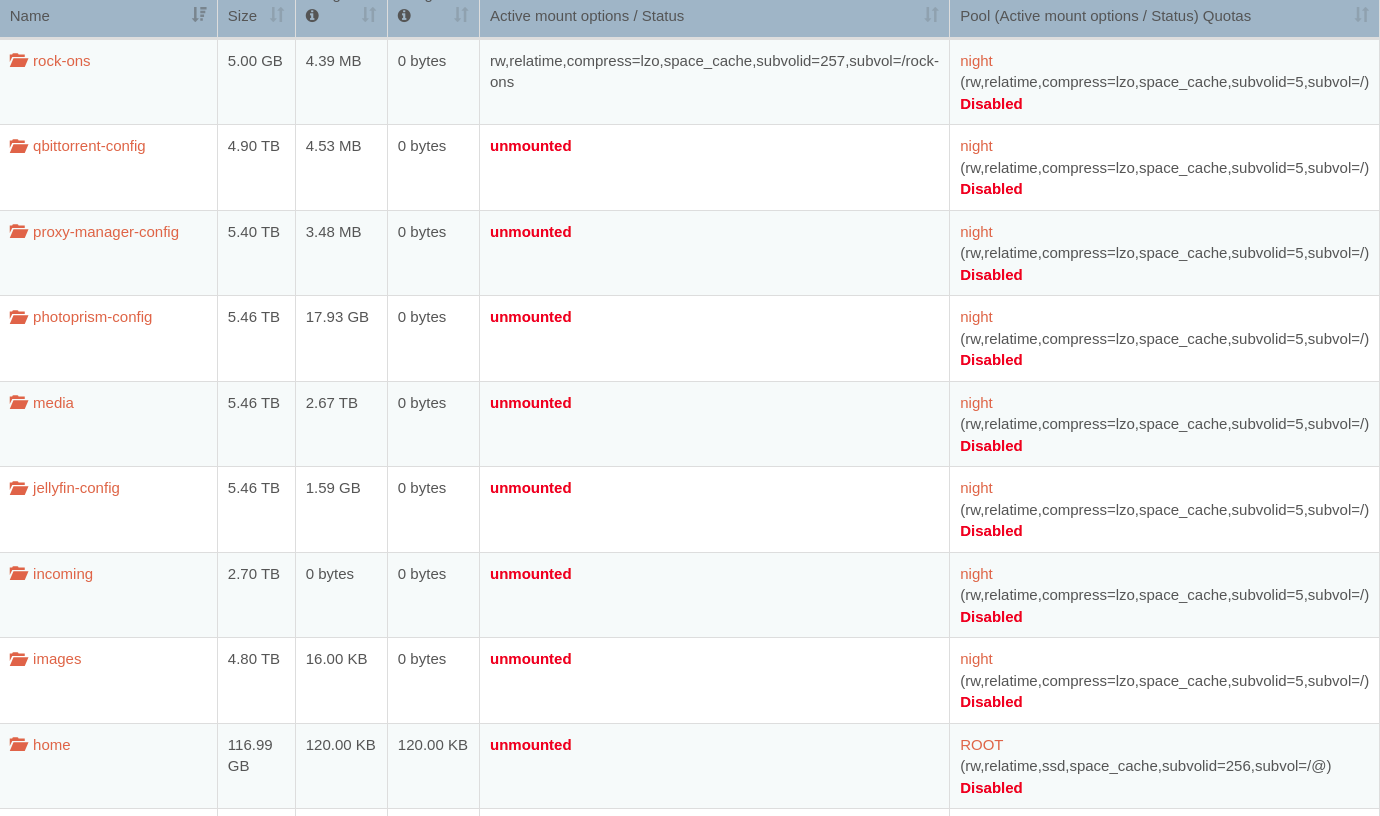
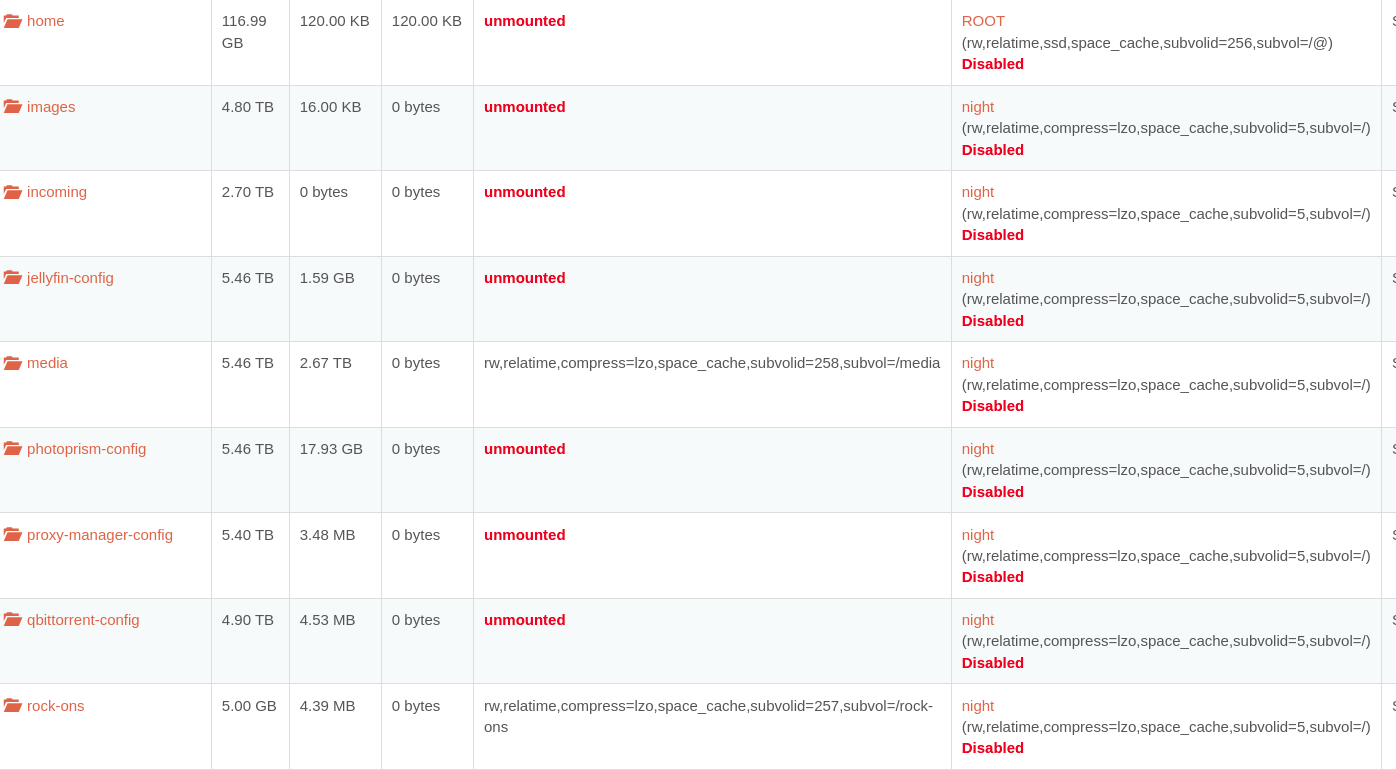
  • All my shares are listed as unmounted, though they still work, even using SMB and NFS

  • The logs show a lot of this, possible related to the rock-on service start failure?:

    [2021-12-16 00:56:15 +0000] [1920] [CRITICAL] WORKER TIMEOUT (pid:7237)
    [2021-12-16 00:56:15 +0000] [7237] [INFO] Worker exiting (pid: 7237)
    [2021-12-16 00:56:16 +0000] [10312] [INFO] Booting worker with pid: 10312

  • gunicorn starts this process roughly every 20 seconds:
    /usr/sbin/btrfs qgroup show -pc /mnt2/dawn
    The command runs for about 17 to 18 seconds and utilizes 100% of one core during the whole time.

  • Similar, but not as often and long, this command runs:
    /usr/sbin/btrfs qgroup assign 0/1641 2015/31480 /mnt2/dawn
    Also utilizing 100% of one cpu core.

  • Possible relevant: ping6 heise.de says network not reachable, though I do have ipv6 addresses assigned and enabled (didn’t have that before the update I think)

I am running version rockstor 4.0.9-0 with kernel Linux: 5.3.18-lp152.106-default

rockstor:/opt/rockstor/var/log # ip addr
1: lo: <LOOPBACK,UP,LOWER_UP> mtu 65536 qdisc noqueue state UNKNOWN group default qlen 1000
    link/loopback 00:00:00:00:00:00 brd 00:00:00:00:00:00
    inet 127.0.0.1/8 scope host lo
       valid_lft forever preferred_lft forever
    inet6 ::1/128 scope host
       valid_lft forever preferred_lft forever
2: eth0: <BROADCAST,MULTICAST,UP,LOWER_UP> mtu 1500 qdisc mq state UP group default qlen 1000
    link/ether d0:50:99:d0:1a:8f brd ff:ff:ff:ff:ff:ff
    inet 192.168.1.157/24 brd 192.168.1.255 scope global dynamic noprefixroute eth0
       valid_lft 39132sec preferred_lft 39132sec
    inet6 fd23:6d09:2216::428/128 scope global noprefixroute
       valid_lft forever preferred_lft forever
    inet6 fd23:6d09:2216:0:2cc8:180e:624b:2c92/64 scope global temporary dynamic
       valid_lft 600734sec preferred_lft 81779sec
    inet6 fd23:6d09:2216:0:d9f:2c59:ee7d:9f7d/64 scope global mngtmpaddr noprefixroute
       valid_lft forever preferred_lft forever
    inet6 fe80::ca9e:9681:1cc7:e375/64 scope link noprefixroute
       valid_lft forever preferred_lft forever
3: eth1: <NO-CARRIER,BROADCAST,MULTICAST,UP> mtu 1500 qdisc pfifo_fast state DOWN group default qlen 1000
    link/ether d0:50:99:d0:1a:90 brd ff:ff:ff:ff:ff:ff
4: docker0: <NO-CARRIER,BROADCAST,MULTICAST,UP> mtu 1500 qdisc noqueue state DOWN group default
    link/ether 02:42:47:91:d2:86 brd ff:ff:ff:ff:ff:ff
    inet 172.17.0.1/16 brd 172.17.255.255 scope global docker0
       valid_lft forever preferred_lft forever
    inet6 fe80::42:47ff:fe91:d286/64 scope link
       valid_lft forever preferred_lft forever

@Marenz I am not sure it’s happening to my installation (same version), but maybe I am looking in the wrong place? How do observe this, just by eyeballing the processes or dashboard, or did you find entries in the logs to that effect?
Final question, do you have quotas active on your instance?

Inquiring minds want to know :slight_smile:

I logged in with SSH and just watched htop for a few seconds (the process is almost always running for me). top works just as well if you don’t have that installed.

Missed your final question: I never enabled them deliberately, but when I looked earlier, my ROOT had quotas enabled, I did disable those though and it made no difference.

Possible related: All my shares are listed as unmounted since I updated. Though I can still cd and ls into them per SSH.

I am not sure if I should list all my issues as they could all be related or not. It’s just too much that is not working :sweat_smile:

1 Like

Very interesting (well, in a scary kind of way, I guess). When you updated (aka rebuilt, I assume) did you have any issues importing the original pool? I am wondering whether that’s related to the unmounted view. I checked also with htop, but for the last 5 minutes I got nothing in there related to a btrfs command.

Ah no, when I say updated, I mean simply from an earlier 4.0.7 version, so no importing or so, just a reboot.

Currently I also can’t start the rock-on services anymore (timeout after 2 minutes).

did you see anything “funny” in the rockstor.log or dmesg abd finally, are you on the Leap15.2 or 15.3 base? I think this might be a case for @phillxnet or @Flox to ask more pointed questions …
Also, what RAID configuration are you running?

I watched pretty much all the logs, including journalctl -f, mostly because of the timeout in the webui when starting rock-on, but there is suspiciously little found (checked all files in /opt/rockstor/var/log).

I thought I could maybe enable debug logging, but so far I couldn’t find the right configuration file for that :expressionless:

My RAID configuration is a simple RAID1/single-disk per pool, though I am running tasks that takes btrfs-snapshots on a regular basis and move them to my other disk as incremental backup.

So no redundancy but backup.

Maybe I should edit the title and my first post to have all the information together. I initially thought I should make one post for each of my issues and started with the “simplest” one to explain

@Marenz Hello again.
Re:

I don’t think it will help in this case but to enable Rockstor debug mode you do:

/opt/rockstor/bin/debug-mode on

Should do you.

From your general description the Web-UI has so many time-outs that it’s unable to represent the true state of affairs. Try closing all Web-UI pages and via ssh disable all quotas. If you did this before via Web-UI it may not have been able to enact the request. Quotas are disabled according to the Web-UI but as with the mounts something is hanging the system to the extent that the Web-UI is failing to pick-up the true state of affairs. Likely there is a problem with the pool that is slowing stuff down and Rockstor works by repeatedly running btrfs commands to pole the pool status. Hence closing the Web-UI to take that pressure off to ensure quotas are for-sure disabled. They are enabled by default during in import and on the systems pool. But disabling them will reduce the CPU overhead and hopefully allow some root to see what’s slowing stuff down.

btrfs qgroup show -f --raw /mnt2/ROOT
# and
btrfs qgroup show -f --raw /mnt2/night

From our:

And disable both for sure via:

btrfs quota disable /mnt2/ROOT
btrfs quota disable /mnt2/night

And look for drive errors via:

btrfs dev stats /dev/disk/by-id/<each-drive-here>

Sometimes when drives are failing they end up taking ages to respond, and if they don’t have NAS timings on their error reporting it can be up to 2 minutes before the kernel gives up on them and requests a reset: looping an error state. But you would see this in a log. Never-the-less if the pauses are no too long all will look ok but everything on the system is dragged down waiting for this.

RAID1 requires 2 disk minimum. Only btrfs raid single can handle a single disk per pool. There is no redundancy or repair capability with btrfs raid single level, irrispective of how many disk you have in the pool -> there is only a single copy of each ‘thing’.

If you have a large number of snapshots then this can end up dragging a systems CPU down to an unworkable level. Ensure you delete all unrequired ones and be sure to not delete too many at a time as snapshot creation is essentially free CPU wise and near enough instant. Snapshot deletion is the opposite in both regards.

If there are timeouts executing btrfs commands (which is what Rockstor does a lot of, especially when the Web-UI is open) and they time out, all bets are off and many things will default to whatever, i.e. the quotas assumed to be disabled when they may not be (that piece of code). Many Web-UI elements will no longer be representative as there is no response from the system that can be parsed; at least within a time-out period.

So I’d concentrate on resolving any slow disk issues, the disk in question will likely also have some btrfs dev stats issues. And check the smart info for issues. And get your snapshot count down. But before all that you may have to ensure quotas are off for sure as othewise you may have a frustrating experience as the system is likely to be grinding along, at least from your info in top of massive CPU usage.

Hope that helps. Also note that if you ran a redundant raid level then the pool could self repair in many circumstances. As is it will simply fail or timeout as there is only a single copy to depend upon, assuming you are running btrfs single level given the single drive count you mention.

3 Likes

@Hooverdan my appologies I accidentally flagged you on this one. I’ve edited my last post accordingly.

1 Like

Woaaa. It seems my quotas are enabled! I thought I never imported those pools and the UI never showed the quota as enbaled. But after investigating a bit, I did, in fact, change my disk configuration at some point and I guess that was when it happened?

But the commands you provided clearly show that they were enabled for both of my disks. I am a bit brain-flashed at that. I was so convinced they were disabled.

I disabled them now and indeed the btrfs commands no longer hog the system and the UI is as fast as I never saw it in my life.

RAID1 requires 2 disk minimum.

Turns out I was wrong, I have three disks and 2 of them in a raid1, the third is the backup one.

All disks seem healthy, no errors whatsoever in the btrfs stats.
Even the rock-on services is simply running now (I didn’t even need to turn it on)

Only thing left now: All the shares I created for my rock-ons are listed as unmounted still. cd & ls confirms that.

My main share with all the data however looks correct.

In any case: Many thanks already, this really blew my mind :laughing:

3 Likes

@Marenz Glad your a little further out of the woods on this one.
I suspect you have way too many snapshots for your hardware capacity, hence the CPU maxing out trying to tally them all up on the quota side. Take care to not delete too many at a time. Also don’t touch snapshots on your rock-ons-root. They are your docker images.

Rockstor does all it’s mounts on initial boot. Some things such as mount options change can cause a re-mount request but otherwise they can remain unmounted. Now you system is a little more responsive and there are hopefully no timeouts it may be worth doing a reboot to ensure those boot-up mount operations are re-tried. Or it may be you pool is poorly and needs a scrub to repair where it can.

Hope that helps. Super frustrating when the Web-UI lets us down like that. We will have to build in some Web-UI warnings about btrfs commands timing out or the like. That way folks can see that the displayed info is essentially uninformed by the system and can then avoid chasing red-herrings.

2 Likes

I am actually using https://github.com/digint/btrbk for my snapshots which makes sure they stay within a certain amount, currently I count 16 snapshots for my large pool.

I am also running a weekly scrubbing on all my disk.

I’ll try the reboot and will investigate some more to see. Will report.

So, it is a bit confusing because in /mnt2/ there is a folder for every share, but all rock-on related ones except the rock-ons one itself are empty.
Then there is my main pool in /mnt2/night which contains again a folder for every share, only those are not empty and contain what I’d expect them to…

I did wonder about those empty folders in /mnt2/ before…

@Marenz Hello again.
Re:

Yes, /mnt2 is Rockstors main mount point. Within that directory it creates mount points named after every pool (btrfs volume label) and every share (btrfs subvol). So:

Yes, this is all good too. Within the context of the unmounted shares (btrfs subvolumes) that you have. Btrfs subvols appear as directories within the Pool (btrfs volume) hence you seeing them within the overall pool mount. And as you see the data is there as expected. It’s only that we don’t have the individual mounts of the subvolumes.

The are the mount points and are empty as they have nothing mounted on them: as you have the ongoing unmounted subvolumes (shares). A btrfs subvolume is almost a filesystem in it’s own right, kind of fractal to the Pool, but not quite. Rockstor mounts each subvolume to gain abstraction and control over it. But the subvolume is just a part of the whole Volume which we need to mount as a whole to control it’s access/mount options.

So when the share mounts are in place (active) then the mount points will then contain the data of that subvolume: abstracted from it’s parent Volume (Rockstor pool).

Hope that helps. We do have a technical wiki entry on this but unfortunately it is now rather outdated so we need to update this at some point.

2 Likes