Drive causing Out of Memory (2gb)in 7 minutes leading to Kernel panic

I have been using Rockstor stable for more than a year. My old Dell Poweredge 1800 (dual 2.8ghz xeon) 2Gb Ram Vertex 2 120gb SSD system with a mixture of sas and sata storage drives on an LSI 9201 16e HBA in JBOD mode). Suddenly starts running out of ram in 7 min from time of boot. It had been up solid for 110 days until this morning. After a lot of messing about with the original ssd boot drive, I started fresh with a different vertex 2 SSD and installed and updated to the latest rockstor 48. including running all yum updates.

On the fresh install, I left Rockons off and the only thing I customized is setting up my mellonox 10gbe adapter. So this installation is as simple and as fresh as I could make it. I can watch in htop the ram slowly filling up… It is very frustrating because I only have about 5 minutes to troubleshoot each time i boot. I can’t see any specific process in htop that is using all the ram, but the meter goes up and crashes at 1.86gb used. Swap is setup and I can see it minimally used.

I was just able to stop the system from crashing by disconnecting and unmounting my 8tb drive (all others already disconnected) I have found out atleast my 8tb seagate drive being present is initiating this. using free -m i found out all the ram (1700mb ) is tied up in buffers and caches. Now why is my system suddenly buffering like this? I haven’t done a single file transfer since reinstalling rockstor. at one point this seems to have coincided with me opening the samba share on my windows computer, but other times I never opened a windows file manager and it still happened.

So how do I figure what and why of caching / buffering until ram is full? and kernal panic.
I’ve looked through a lot of logs. dmesg, rockstor, and more, but not sure i saw anything conclusive maybe i just don’t know what i’m looking for.

i’ve also tried

# echo 3 > /proc/sys/vm/drop_caches

which did nearly nothing… so that means caches are dirty? i’m over my head in understanding this, but i’ll keep digging.

Update: I now can say that the old and new rockstor install work without my 8tb drive connected. All the other pools are connected and stable.

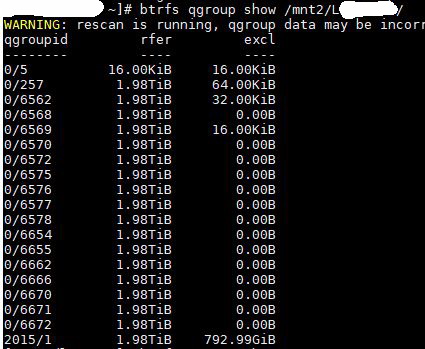
Update: Here is an excerpt from dmesg: maybe a quota rescan is causing memory usage. I use snapshots but only have 1 subvolume on this particular disk. i don’t remember messing with quotas one way or another. the following messages appear when i unplug drive (not ideal, but the server is going to crash anyways if i don’t unplug)

INFO: task kworker/u8:1:30610 blocked for more than 120 seconds.
[22611.072819] Not tainted 4.12.4-1.el7.elrepo.x86_64 #1
[22611.072921] “echo 0 > /proc/sys/kernel/hung_task_timeout_secs” disables this message.
[22611.073046] kworker/u8:1 D 0 30610 2 0x00000080
[22611.073125] Workqueue: btrfs-qgroup-rescan btrfs_qgroup_rescan_helper [btrfs]
[22611.073130] Call Trace:
[22611.073145] __schedule+0x28a/0x880
[22611.073152] schedule+0x36/0x80
[22611.073197] wait_current_trans+0xc7/0x100 [btrfs]
[22611.073204] ? remove_wait_queue+0x60/0x60
[22611.073249] start_transaction+0x28a/0x440 [btrfs]
[22611.073295] btrfs_start_transaction+0x1e/0x20 [btrfs]
[22611.073343] btrfs_qgroup_rescan_worker+0x83/0x5a0 [btrfs]
[22611.073394] normal_work_helper+0xc0/0x2f0 [btrfs]
[22611.073443] btrfs_qgroup_rescan_helper+0x12/0x20 [btrfs]
[22611.073450] process_one_work+0x149/0x360
[22611.073455] worker_thread+0x4d/0x3c0
[22611.073459] ? _raw_spin_unlock_irqrestore+0x15/0x20
[22611.073464] kthread+0x109/0x140
[22611.073468] ? rescuer_thread+0x380/0x380
[22611.073471] ? kthread_park+0x60/0x60
[22611.073477] ? do_syscall_64+0x67/0x150
[22611.073481] ret_from_fork+0x25/0x30
[22611.073536] INFO: task btrfs-transacti:2151 blocked for more than 120 seconds.
[22611.073659] Not tainted 4.12.4-1.el7.elrepo.x86_64 #1
[22611.073758] “echo 0 > /proc/sys/kernel/hung_task_timeout_secs” disables this message.
[22611.073881] btrfs-transacti D 0 2151 2 0x00000080
[22611.073887] Call Trace:
[22611.073894] __schedule+0x28a/0x880
[22611.073899] schedule+0x36/0x80
[22611.073945] btrfs_commit_transaction+0x7f3/0x900 [btrfs]
[22611.073949] ? remove_wait_queue+0x60/0x60
[22611.073994] transaction_kthread+0x18a/0x1c0 [btrfs]
[22611.073999] kthread+0x109/0x140
[22611.074044] ? btrfs_cleanup_transaction+0x520/0x520 [btrfs]
[22611.074048] ? kthread_park+0x60/0x60
[22611.074052] ? do_syscall_64+0x67/0x150
[22611.074055] ret_from_fork+0x25/0x30

If rescanning quotas is properly taking up ram, then how much ram does this process need? I have 8gb of ram ordered.

So I see rockstor says quotas are disabled on this particular drive. is this a problem with having snapshots?. i started taking regular snapshots several months ago. What would the implications of trying to turn quotas on?

thanks,
Darrell

@dlsound Welcome to the Rockstor community.

My first though on this is that you have too little memory for larger TB btrfs pool storage especially if you have yet to disable quotas. It may be worth a try. Given you are on stable channel this a viable, if not yet ideal, setting. But for larger pools / btrfs vols and in such settings as pool modifications (adding devices) and balances it can stress lower memory systems overtly. We actually have a pending rockstor-doc pull request to update our doc section:
Minimum system requirements
to have a recomended 4GB+ recommendation.

The above assumes that you have recently started some long running task, such as a pool change, balance or the like, and that this is what is causing the issue. Otherwise I’m off the mark given you have had no issues until now. But the more snapshots you have the worse it gets memory CPU wise.

Also re:

Do make sure you are definitely running 3.9.2-48 via for example:

yum info rockstor

as sometimes, when shifting from testing to stable channel updates, the Web-UI can show available rather than installed, to be fixed in next iso release and already in code.

Another thought is that, given cache / buffers usually grow to fill all memory pretty much, by design. You memory may have gone bad. You could see our Pre-Install Best Practice (PBP) subsection:
Memory Test (memtest86+)
for one way to check your memory.

OK, just read your updates to this post, re

and given you stated that removing the 8TB device returned stability:

we may be onto something.

Strange. But it could still be that the additional load of ‘managing’ the extra space is tripping up the quota calculations / work space still.

Try for the time being (after memory check) to disable quotas across the board. At least until you extra memory arrives.

No. Only share size usage is reported as zero shortly after disabling quotas and stays that way as we rely on quotas to monitor this. Bit of a shame but much progress has been made on improving quotas performance impact recently upstream and we should inherit this once we get our openSUSE move under way.

I didn’t notice the raid level you are using. Btrfs 5/6 are known to have higher RAM / CPU impact and are also currently less stable. Just an idea.

Higher memory and CPU use.

Let us know if disabling quotas across the board works for this issue. But the extra memory (after checking existing and new memory) is also highly advised also. Plus we have a pending pull request that is destined for our belated 3.9.2-49 release that should also help with the Rockstor side of performance, although that is mainly interactivity related and shouldn’t affect memory use that much.

Hope that helps and well done on working through this. And thanks for helping to support Rockstor’s development.

thanks for the input!!!

I was running a balance on a single 2TB pool that had run out of usable space… it was slow and had been running for 3 days and was somewhere around 60% complete. after the crash and reboot the balanced shows 100% complete. I have no idea if it properly finished before the crash. The last task I ran to the 8TB pool was a scrub a month previously. so I don’t know if the seemingly unrelated pool balance is related.

Installed Packages
Name : rockstor
Arch : x86_64
Version : 3.9.2
Release : 48

I ran the memory test for 2 pass with no errors.

I disabled all quotas, however, the system pool turns its own quotas back on. and the 8TB problem pool seems fixated on re-scanning quotas. I think this quota rescan could be the out of memory culprit. I tried running btrfs quota disable /mnt2/L… in terminal as root and it won’t complete the task and the rescan doesn’t stop.

BTRFS%20qgroup%20rescan%20running

The 8TB pool drive in question is “Single” I also run a 4TB Raid 1 and 2TB Raid 1 and some 2TB singles. On my limited budget, using btrfs to slowly transition from windows, then from singles to Raid 1 has been a key consideration in choosing Rockstor! I also have 2 rotating offsite copies that are all btrfs singles.

The new set of memory should arrive today, then i’ll memtest that and see if the quota rescan on this drive will complete.

thanks for your reply! I’m a new user on the forum, but have been viewing the forums since fall of 2016. In 2017, I ran Rockstor as a test storage server with the intention of switching from windows for storing files. That went really well, so I made the transition to all btrfs drives on Rockstor in the spring of 2018 and love it! thanks for all your hardwork!

@dlsound Thanks for the update.

I’m feeling a little sorry for your machine at this point, given it’s 2GB of RAM! So the following is good news all around:

It does look like, from the prolonged rescan, that your machine is having memory pressure issues and once all quotas have finally settled to their OFF setting you should see a relief of sorts in memory pressure and performance. But still that extra memory should relieve things quite a bit.

Qgroup re-scans can take quite some time, especially with many snapshots / sub-volumes (shares/snapshots) in play.

I’m chuffed that you are finding facility in Rockstor and thanks for your detailed reports.

I am happy to report that the system has worked out it’s issues with the increased ram!

After adding the 8GB of RAM and passing memtest, I plugged in my problematic 8TB drive. After the qgroup rescan started, the memory started climbing as previously observed to 2.5GB Used. Then started falling down to about 1GB. It climbed a few more times in the rescan process with the highest being 4.5GB used. I also noticed BTRFS-cleaner and kworker throwing some errors:

[ 3687.597225] INFO: task kworker/u8:0:28844 blocked for more than 120 seconds.
[ 3687.597365] Not tainted 4.12.4-1.el7.elrepo.x86_64 #1
[ 3687.597462] “echo 0 > /proc/sys/kernel/hung_task_timeout_secs” disables this message.
[ 3687.597592] kworker/u8:0 D 0 28844 2 0x00000080
[ 3687.597679] Workqueue: btrfs-qgroup-rescan btrfs_qgroup_rescan_helper [btrfs]
[ 3687.597684] Call Trace:
[ 3687.597699] __schedule+0x28a/0x880
[ 3687.597705] schedule+0x36/0x80
[ 3687.597748] wait_current_trans+0xc7/0x100 [btrfs]
[ 3687.597754] ? remove_wait_queue+0x60/0x60
[ 3687.597801] start_transaction+0x28a/0x440 [btrfs]
[ 3687.597847] btrfs_start_transaction+0x1e/0x20 [btrfs]
[ 3687.597897] btrfs_qgroup_rescan_worker+0x83/0x5a0 [btrfs]
[ 3687.597949] normal_work_helper+0xc0/0x2f0 [btrfs]
[ 3687.598000] btrfs_qgroup_rescan_helper+0x12/0x20 [btrfs]
[ 3687.598007] process_one_work+0x149/0x360
[ 3687.598039] worker_thread+0x4d/0x3c0
[ 3687.598045] kthread+0x109/0x140
[ 3687.598050] ? rescuer_thread+0x380/0x380
[ 3687.598053] ? kthread_park+0x60/0x60
[ 3687.598058] ret_from_fork+0x25/0x30
[ 3687.598073] INFO: task btrfs-cleaner:29307 blocked for more than 120 seconds.
[ 3687.598185] Not tainted 4.12.4-1.el7.elrepo.x86_64 #1
[ 3687.598279] “echo 0 > /proc/sys/kernel/hung_task_timeout_secs” disables this message.
[ 3687.598406] btrfs-cleaner D 0 29307 2 0x00000080
[ 3687.598412] Call Trace:
[ 3687.598419] __schedule+0x28a/0x880
[ 3687.598424] schedule+0x36/0x80
[ 3687.598470] wait_current_trans+0xc7/0x100 [btrfs]
[ 3687.598476] ? remove_wait_queue+0x60/0x60
[ 3687.598526] start_transaction+0x28a/0x440 [btrfs]
[ 3687.598573] btrfs_start_transaction+0x1e/0x20 [btrfs]
[ 3687.598616] btrfs_drop_snapshot+0x469/0x880 [btrfs]
[ 3687.598667] btrfs_clean_one_deleted_snapshot+0xcf/0x120 [btrfs]
[ 3687.598712] cleaner_kthread+0x135/0x180 [btrfs]
[ 3687.598718] kthread+0x109/0x140
[ 3687.598764] ? btree_invalidatepage+0xa0/0xa0 [btrfs]
[ 3687.598768] ? kthread_park+0x60/0x60
[ 3687.598772] ret_from_fork+0x25/0x30

At the completion of the rescan I see the following log:
[10070.201002] BTRFS info (device sdi): qgroup scan completed (inconsistency flag cleared)

After the rescan had finally completed properly, I disabled quotas on this drive.
I then ran a scrub on the 8TB pool with no issues:
The Ram usage has since stayed down in a normal range (over 24 hrs)

this morning, I re-enabled quotes on the 8TB drive and it started another quota rescan. This time, no abnormal ram usage and it has finished the rescan successfully.

I guess I can’t even say that I’m certain that the quota rescan specifically was the RAM hog, but the climbing RAM usage started a the same time as the quota rescan when the pool was mounted. and the high ram usage continued up and down until the rescan was complete.

My conclusion: Whatever happened to the btrfs pool, btrfs needed more than 2GB of Ram to resolve the issue.

@dlsound Glad you got it sorted and thanks for sharing your findings.

Re the kernel issues during this we are rather behind things on that front but once we move to an openSUSE base then we get all their vetted backports (Leap variant) of btrfs so we should be in a better place. And in the case of the Tumbleweed variant then we get the latest kernel pretty much anyway.

Yes, does look that way. And not that surprising given the multiple multi TB pools it was required to ‘track’. Would be interesting to see how the newer kernels / btrfs-progs cope but it’s a pretty reasonable requirement still.

Thanks again for the feedback.