In the web UI, the graphs of network throughput and disk IO are welcome, but one has to change between the targets with a dropdown. I’d appreciate being able to expand the set with a button somewhere that shows graphs for all disks in a column (putting them all on the same graph would be too many lines), and similarly for all network interfaces. The top graph could still represent an average over all items below, much as the CPU currently does. That would give us a large general display, with more detail below, or when not expanded, the ability to select a single device as currently happens.
2 Likes
Howdy.
I don’t carry any official weight here, but I’ve read somewhere that these graphs might get replaced with the snazzy Grafana graphs in the future. I don’t know if any work will be done on the current graphs. I assume not.
But there are other options. You could install the netdata rockon which is a free all-in-all monitoring system that has auto-discovery (but some features are locked behind their cloud account).
And I am currently working on a new observability stack Rockon (with a tutorial), that is harder to setup, but is fully self-hosted. The rockon json is in end stages, but the dashboard itself still needs to be defined.
@phillxnet would you be up for a debate about what to include on the dashboard that would be relevant to the Rockstor users? I am using Opentelemetry collector contrib and Grafana (with VictoriaMetrics as the backend).
I find the host metrics and docker stats to be most useful.
4 Likes
@aremiaskfa Re:
That is correct, other projects specialise in such things, and our little widgets have no history, which is a major omision/short-comming. We originally planned to incorporate netdata before they started to covertly incorporate closed source into their Web elements. This lead us to discover the OpenTelementry stuff:
Which looks like a fantastic project I had no idea about myself before hand. And yes, Grafana for the visualisation side. In the back-end I’d planned to adopt Promethius as the OS telemetry backend as it plugs into Alloy nicely. Where Alloy is intended as our backend manager.
My hope at least was that our Dashboard (and the Alloy backend) could also server to monitory other OpenTelemetry compatible sources: e.g. other machines on the network. I.e. a Rockstor install could then server as a monitoring station for what-ever else folks want to maintain time-based metrics for.
Front-end wise - the graphics itself - we have initial plans to, as you read, employ the open source work of Grafana in that area. We do already have docs on how one can connect a Promethius backend running on Rockstor to the Cloud offering in our docs:
And that doc was a result of us looking at alternative to our current scrappy real-time dashboard.
Nice.
Absolutely - this is all in the contemplative phase currently. However I rather like Promethius as an OS telemetry source given it’s extensive history and licensing etc. Plus I have some familiarity with it and Alloy already and some long running experiments with it’s robustness have proven very promising.
Although this would be more of a discussion of course ![]() - which you have begun already here - than a debate. I’m keen to steer clear of such efforts that go or could go dark such as the netdata fiasco however. So licensing is super important for us to keep in mind.
- which you have begun already here - than a debate. I’m keen to steer clear of such efforts that go or could go dark such as the netdata fiasco however. So licensing is super important for us to keep in mind.
As is we have taken a small step towards this dashboard replacement in current testing via the recent efforts of @Hooverdan in the following as yet unrelease in rpm form work:
Where there-after we will have a systemd service spun out from the now dated supervisord named rockstor-collector.service predominantly concerned with our dashboard and some live header info. All of which is due to be replaced with newer technologies. But for this initial phase we just needed to be rid of supervisord to assist with our current efforts in updating our backend ready to facilitate newer technologies on the front end also.
Thanks for the links by the way, I’ll have a look when I get the time.
Thanks for your work there - always good to have informed input.
Please do feel free to chip in ideas as very little is written in stone as yet - but do keep licensing in mind. And look to what has happened to netdata of late re their covert distribution of closed source under an open source license (zip in source).
Hope that helps
3 Likes
The OpenTelementry’s Collector contrib (otelcol) can be installed as a container, but it might be better suited to be included as a Rockstor Service. Of course, it depends largely on how we want to use otelcol within Rockstor.
If we want to use hostmetrics at all, we need to add to the rockon the following option:
[ "-v", "/:/hostfs:ro" ],
*provides access to host's entire filesystem
If we want to monitor “Network interface I/O metrics & TCP connection metrics” (hostmetrics - network scraper), we need to include
[ "--security-opt", "systempaths=unconfined" ],
*provides access to /proc and /sys
[ "--network", "host" ],
*provides access to host network interfaces
If we want to use dockerstats to monitor Rockons, then we need to include:
[ "-v", "/var/run/docker.sock:/var/run/docker.sock:ro" ],
[ "--user", "10001:docker" ]
*provides access to docker.sock
This might not be so bad.
But if we ever want to collect logs from journald, then we either have to publish our own docker image with the matching journalctl, or install it as a Rockstor Service.
For my private observability stack I’ve decided to leave otelcol containerized, and have installed fluent-bit manually via zypper. Although not perfect, I find that fluent-bit complements otelcol nicely. Any logs or metrics that I collect via fluent-bit, I send to otelcol. I will not include log collection into the public observability stack Rockon that I intend to publish to the rockons-registry.
One thing I still need to check with otelcol is, if it is possible to get the Avg I/O, Writing, Reading disk activity times.
Initially I wanted to find a lightweight Grafana alternative, but when I read in their docs that it is not really resource-hungry for small homeservers, I decided to go with it and am happy to have done so. ![]()
It uses on average around 300MB of memory (peak at 514MB). And I have 4 dashboards, one of which is unnecessarily large.
I have decided against Prometheus, because when I have been doing my research I wasn’t sure of its resource-usage. Of course, it is very possible that it is a non-issue on small homeservers. I haven’t tested. I’ve opted for the Victoria* backends, because the internet seems to think that they are really efficient. Memory-, CPU-, network-, and I/O-wise. And it is Prometheus-compatible, so it can be registered in Grafana as a Prometheus backend. Though, there are some differences with their version of the PromQL query language.
I have no prior experience with any metric DB, so I have no favourites.
But. Resource-efficiency is important to me. So any official Rockstor future observability stack should not use a lot of system resources. My current private stack (fluent-bit + otelcol + victorialogs + victoriametrics + grafana) is using around 1GB of memory (peak 1.5GB) and negligible CPU. The published stack will not include logs.
Though I do have to mention that I collect telemetry every 2 minutes, which is probably unorthodox. Rockstor’s solution will probably collect every… 5 seconds? 10 seconds?
I guess at this point I would like to add to the “requirements” that the collection interval should be user-defined. For example, the user should be able to choose from a preset list of interval values. E.g. 5s, 10s, 20s, 1m, 2m. I’ve read somewhere that setting the interval to more than 2m is not recommended, though I haven’t followed-up on the “why”.
The retention time of collected metrics should probably also be user-defined.
I have decided to skip Alloy completely for now, although I hear mostly good things about it.
Ahh, I haven’t thought about licensing at all!
What kind of licensing is acceptable? Anything compatible with GPL-3.0-or-later?
That’s horrible. I was already turned off, when I’ve heard about forcing users to sign up for their cloud account for some of their features, but this is some next-level shadiness.
BTW, the netdata Rockon probably needs to be updated. I think it was created in the netdata v1.x era, and probably doesn’t work anymore with the latest docker image.
So privately I have created a huge dashboard which doesn’t make sense for Rockstor. But maybe some charts would be suitable. So I am thinking of providing some screenshots and we can discuss if any of them would make sense.
One thing I will have to think about is that the Grafana queries will have to be written in a generic way. The charts should look acceptable no matter the number of disks the user has, or number of containers.
We’ll see. I’m still experimenting ![]()
4 Likes
Update: I have submitted two PRs in this direction:
- a monitoring starter kit Rock-on,
- with the corresponding installation and short usage guide
If anyone is eager to test it out, one can place the rock-on JSON file in your /opt/rockstor/rockons-metastore folder, and then click on the Update button in the Rockstor > Rock-Ons web UI.
But before you attempt the install, there are some extra pre-install steps needed to be performed.
In other news, I have also had an attempt at a basic dashboard:
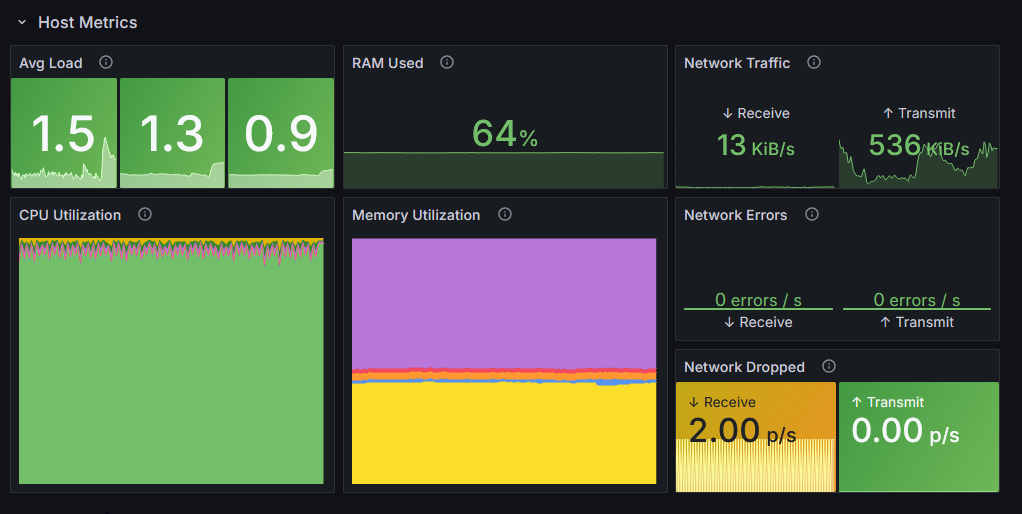
This dashboard is a part of the whole rockon thing, but can be worked-upon and published separately.
1 Like