Hi folks.
I want to ask if this is normal behavior or something is wrong. I have freshly installed Rockstor Leap15.3 in Hyper-V, 8GB ram assigned. Just to begin I have here one 1TB POOL and one share published by smb.
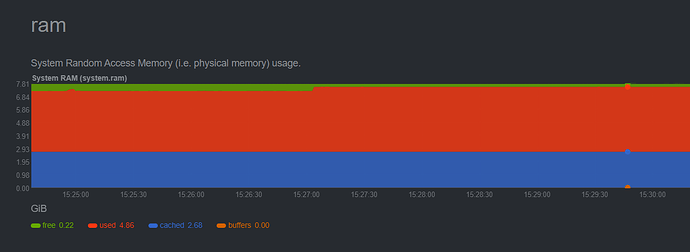
After one day of just sitting here, it has about 90% used 5% cached ram. That doesn’t sound right to me.
When I list processes by mem usage:
…
984 139596 postgres
1057 139596 postgres
13312 139596 postgres
2621 145088 snapperd
2519 166524 gpg-agent
1494 217112 (sd-pam)
828 247508 nmbd
13077 305432 gunicorn
13076 305604 gunicorn
16812 325932 smbd-notifyd
16813 325948 cleanupd
16814 332092 lpqd
16810 332108 smbd
13059 332408 data-collector
16852 342676 smbd
507 456844 NetworkManager
13060 508560 django
Oh it is just a problem with reporting of Dynamic Memory
It is just not aware of it
@Miyuki Welcome to the Rockstor community.
Re:
possible. Linux Memory use can be tricky to understand, I have only a user perspective on this. But it’s generally pretty good as it goes.
Take a look at the output of say:
cat /proc/meminfo
And look up the meanings of the various entries and you should get a better idea of what’s going on.
You might also like our netdata Rock-on. Netdata: https://www.netdata.cloud/ can also help to understand what’s going on by breaking out graphically over time, what system resource is used by what process or family of processes. Sometimes programs like postgres are actually a family of processes and the for example share a resource between them. have a look at for eample:
ps -x --forest
Let us know how you get on. But the netdata Rock-on may be worth a look given it’s extreme capabilities and it only ends up taking a few percent of resources for itself.
Hope that helps.
The issue is
cat /proc/meminfo

MemTotal:        8142420 kB
MemFree:          341624 kB
MemAvailable:    2516380 kB
Buffers:            5028 kB
Cached:          2406776 kB
SwapCached:            0 kB
Active:          1710300 kB
Inactive:        1323896 kB
While free calculates “used” from thin air
free
              total        used        free      shared  buff/cache   available
Mem:        8142420     5288828      352048       62380     2501544     2530452
I can live with this when I know what is going on
Just the usage numbers are off and GUI takes them
See what you can gain, info wise, from the netdata Rock-on. That may shed more light on exactly what’s happening.
But the meminfo looks healthy. Lots of Cache and MemAvailable.
It shows same usage as other what is not right
Event that cached value is not right
Committed Memory is 2.5GB now
percentage wise “used” going down over time as it balloons memory size
All the problem is it showing 8GB total while it have now 4114MB, just kernel reports it wrong
But it works without issues
But the kernel report is canonical. It’s what manages memory in the first place. Further down the page in netdata’s report are indicators of what is using memory I think (from memory ![]() ).
).
I don’t think I’m quite grasping your perceived/actual issue actually. Apologies for this but at least you now have multiple indicators of ‘stuff’ and you should be able to fathom the nature of the system’s resources from there. And keep in mind that memory can be allocated to in many different ways. I.e. pinned for the sole use of a single process or available to be used by a family of processes. Not really my area of expertise but netdata is very well respected and has many years of linux reporting under it’s belt so it’s probably a good reference, bar of course the command line tools.
You may well have a situation where you db’s are grabbing their own caches over time and pinning it, and it may take quite some time to stabilise.
Also note that swap can be ‘memory’ as such. But your earlier command line reports indicated no use of it. Memory that is not active can often be temporarily reloacted to swap in memory pressure situations so that the actual real memory (RAM) can be freed up for active use where it will do the most use, assuming the inactive hasn’t been purposefully pinned that is.
Hope that helps and glad to see the netdata Rock-on being of use again.
