What should I look for in the logs?
@avan Hello again.
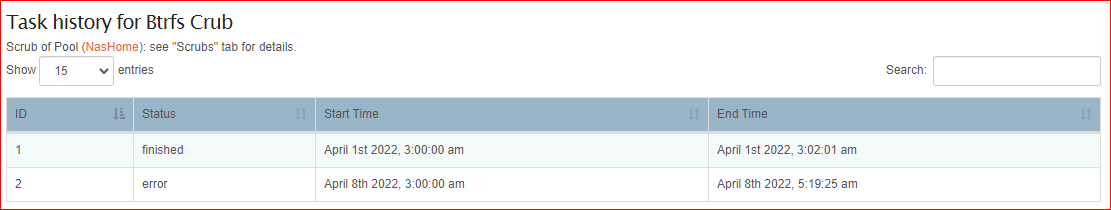
Check out the details page for Pool concerned by clicking on the link provided there.
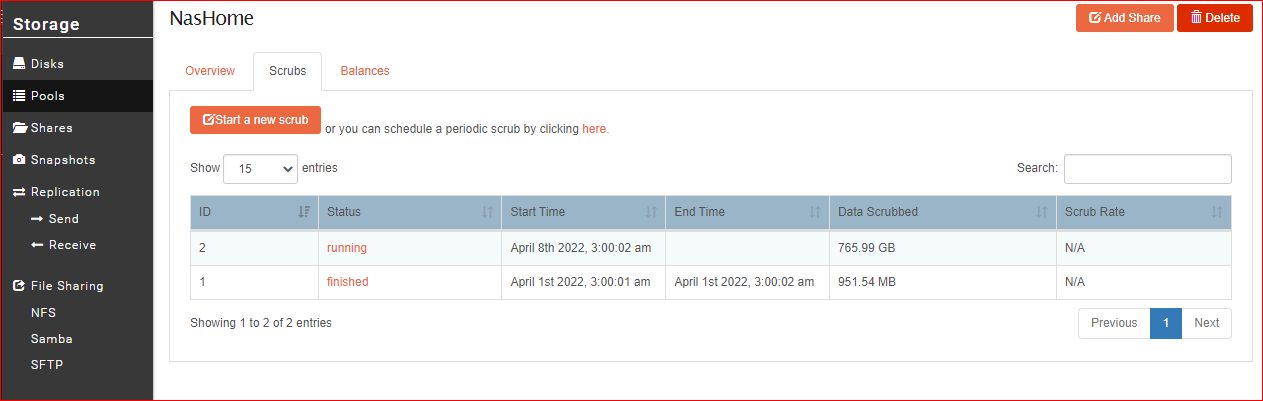
The take a look at the Scrubs tab within that page.
If you are on a new enough Rockstor it should give you a complete breakdown on the stats of the last completed scrub.
Hope that helps.
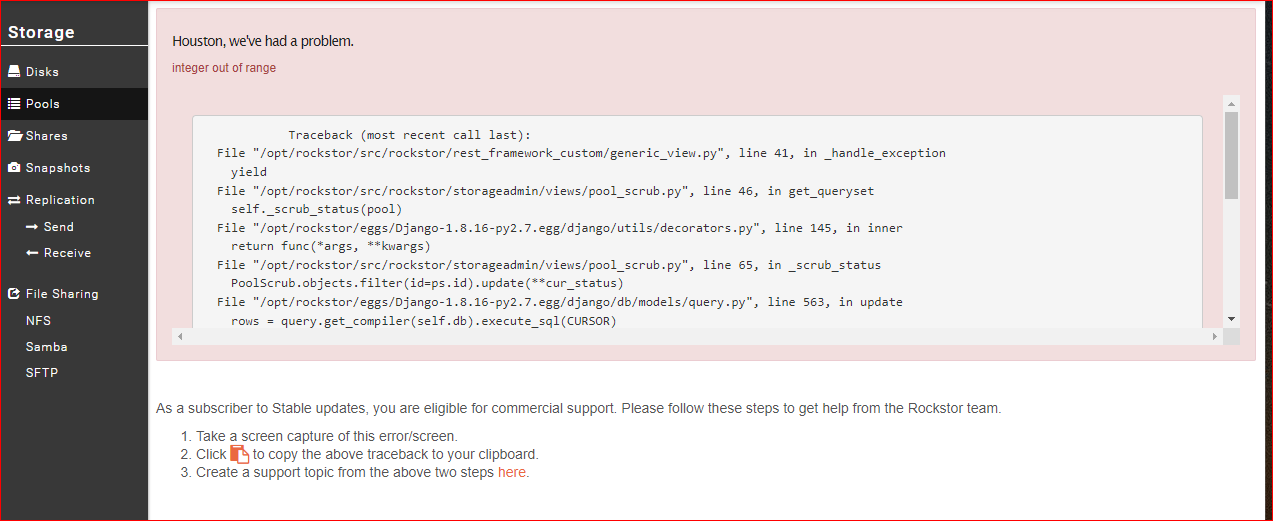
I am seeing the following error.
> DataError: integer out of range
Traceback (most recent call last):
File “/opt/rockstor/src/rockstor/rest_framework_custom/generic_view.py”, line 41, in _handle_exception
yield
File “/opt/rockstor/src/rockstor/storageadmin/views/pool_scrub.py”, line 46, in get_queryset
self._scrub_status(pool)
File “/opt/rockstor/eggs/Django-1.8.16-py2.7.egg/django/utils/decorators.py”, line 145, in inner
return func(*args, **kwargs)
File “/opt/rockstor/src/rockstor/storageadmin/views/pool_scrub.py”, line 65, in _scrub_status
PoolScrub.objects.filter(id=ps.id).update(**cur_status)
File “/opt/rockstor/eggs/Django-1.8.16-py2.7.egg/django/db/models/query.py”, line 563, in update
rows = query.get_compiler(self.db).execute_sql(CURSOR)
File “/opt/rockstor/eggs/Django-1.8.16-py2.7.egg/django/db/models/sql/compiler.py”, line 1062, in execute_sql
cursor = super(SQLUpdateCompiler, self).execute_sql(result_type)
File “/opt/rockstor/eggs/Django-1.8.16-py2.7.egg/django/db/models/sql/compiler.py”, line 840, in execute_sql
cursor.execute(sql, params)
File “/opt/rockstor/eggs/Django-1.8.16-py2.7.egg/django/db/backends/utils.py”, line 64, in execute
return self.cursor.execute(sql, params)
File “/opt/rockstor/eggs/Django-1.8.16-py2.7.egg/django/db/utils.py”, line 98, in exit
six.reraise(dj_exc_type, dj_exc_value, traceback)
File “/opt/rockstor/eggs/Django-1.8.16-py2.7.egg/django/db/backends/utils.py”, line 64, in execute
return self.cursor.execute(sql, params)
DataError: integer out of range
@avan This does not look like an actual scrub error but more, from:
Our code trying to retrieve (get_queryset of _scrub_status(pool)) the last scrub status details.
Pretty sure this is a bug report to us actually.
For your own piece of mind for now try, from the scrub tab of the pools details page, starting a manual (rather than scheduled) pool scrub. You should then be able to live monitor the results of that pool scub. The main thing here is to ensure the pool health. We can then move to looking at what went wrong with the scheduled pool scub. We do have some known instability in the scheduled tasks that we have in mid to improve as we update our python version in time.
Let us know how that manually initiated scub goes. Also you may want to remove the scheduled scrub task before hand and then try re-doing it after you are assured the pool scrubs manually OK.
Hope that helps.
2 Likes
This is the error I get when I click the pool name. I am reading the docs to identify the command line options. Please share the CLI options if you have it handy.
I restarted the appliance and I still get the same error when I click the pool name for details.
RiversideNas:~ # btrfs scrub status -d /mnt2/NasHome/
RiversideNas:~ # btrfs scrub start -d /mnt2/NasHome/
This run fixed the UI problem. Even though it finished in a minute, I think the previous weekly scrub failed. The amount of data scrubbed during this manual run is vastly different from that of the last run, even though the pool is relatively the same size with minor additions and deletions.
1 Like
@avan Glad you managed to work around this issue, and thanks for the update.
Likely there was a bug holding up reporting.
Note that we don’t necessarily report correctly on command line initiated scrubs. Always best to initiate via the Web-UI (when possible anyway).
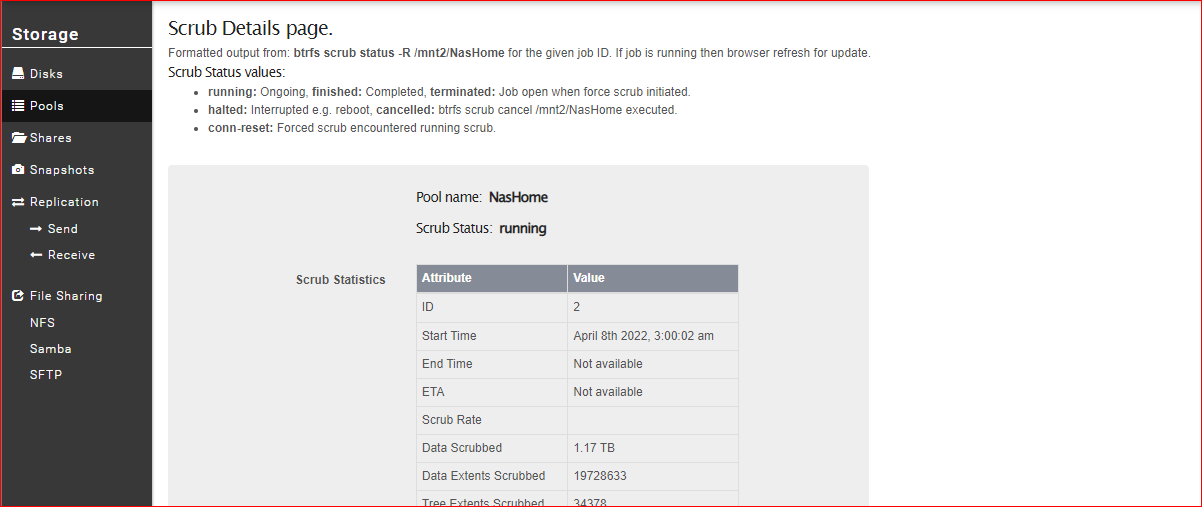
The pictures you show are with the scrub still running. They can take several hours depending on the hardware, raid level, amount of data / metadata etc. Incidentally we use the following for our btrfs status command internally:
Hope that helps.
1 Like