Hi everyone
A few days ago I let the usage of a raid5 pool get up to 100%. This has also happened before and didn’t lead to any problem, this time however the pool went read-only, and I can’t get it to mount read-write.
I tried remounting the pool with sudo mount -o remount /dev/sda, but that does not seem to do anything.
I have tried extending the pool with usb drive, I tried changing the pool to “single” instead of raid5.
I have some device errors, which I don’t really know where they come from.
Is there a way to upload a *.txt file? I have the response to ‘btrfs check -force -p /dev/sda’ concluding with “ERROR: errors found in fs roots” and also for ‘dmesg’ which again is riddled with errors. If that or anything else helps locating the problem, please let me know. Any help is much appreciated.
Edit: I just got a little further. By adding the extra mount option “skip_balance”, the pool mounts as rw. I can also enter the file structure with “cd”, but as soon as I try to delete anything or even just list directories through “ls”, the pool switches to read-only again. Trying to add a disk (well, an 8GB USB drive) also switches the pool back to read-only.
@schoschi12, typically people provide a link to an external storage location to share larger files (hosted on github, bitbucket, etc.), as the forum currently only handles graphic formats (jpg, png, etc.) as attachments.
Can you clarify whether you are still running on 3.9.x or is this the 4.x on OpenSUSE Rockstor version? That might make a difference mostly because the 3.9.x version of btrfs-progs is pretty old, so might have more issue dealing with a 100% scenario (though that seems to be a weak spot of brtfs occasionally still).
2 Likes
@Hooverdan: Thanks for the info. I hope you can access the files here:
https://github.com/schoschi12/Rockstor_trouble.
I’m using OpenSuse 4.1.0-0.
I hope this helps.
again, I suspect @phillxnet can help here much more, but when looking at your dmesg logs, it seems that one of your hard disks is failing during startup (system tries a couple of times by hard resetting the link), which in turn possibly causes btrfs to flip out.
(…)
[ 1.355343] ata1.00: ATA-10: WDC WD40EFRX-68N32N0, 82.00A82, max UDMA/133
(…)
[ 53.437568] ata1.00: exception Emask 0x10 SAct 0x1000 SErr 0x400101 action 0x6 frozen
[ 53.437581] ata1.00: irq_stat 0x08000000, interface fatal error
[ 53.437589] ata1: SError: { RecovData UnrecovData Handshk }
[ 53.437597] ata1.00: failed command: WRITE FPDMA QUEUED
[ 53.437609] ata1.00: cmd 61/80:60:00:1a:71/00:00:55:00:00/40 tag 12 ncq dma 65536 out res 40/00:60:00:1a:71/00:00:55:00:00/40 Emask 0x10 (ATA bus error)
[ 53.437620] ata1.00: status: { DRDY }
[ 53.437629] ata1: hard resetting link
[ 53.750850] ata1: SATA link up 6.0 Gbps (SStatus 133 SControl 300)
(…)
[ 54.477872] ata1.00: status: { DRDY }
[ 54.477874] ata1.00: failed command: WRITE FPDMA QUEUED
[ 54.477877] ata1.00: cmd 61/80:a0:00:1a:71/00:00:55:00:00/40 tag 20 ncq dma 65536 out res 40/00:a0:00:1a:71/00:00:55:00:00/40 Emask 0x10 (ATA bus error)
[ 54.477881] ata1.00: status: { DRDY }
[ 54.477884] ata1: hard resetting link
[ 54.790724] ata1: SATA link up 3.0 Gbps (SStatus 123 SControl 320)
In the end it even tries to reduce the link speed to 3.0Gbps (from originally 6.0Gbps). Now, this could be a controller, cable or other issue, but I did read that one can consider the DRDY status a hardware failure.
The intermittent ACPI errors you’re getting are supposedly non-critical and are usually related to how a motherboard/BIOS implemented the ACPI specs, and if they don’t align with what the kernel expects, these errors are thrown. But, that’s more secondhand info that I have seen.
So, in the end not sure whether you’re seeing the 100% consumption because you’ve been dragging a failing disk with you for a while, or a controller connection is not seated right/cable defective.
Maybe you can query the disk in question using smartctl (info or even run a short test on it).
2 Likes
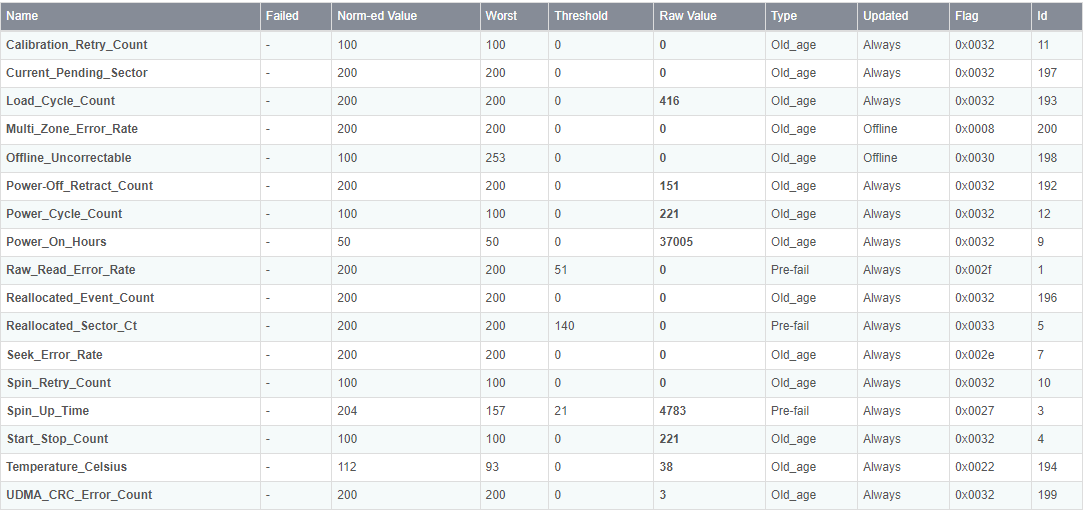
I ran a short self test on all drives. All of them presented not great results, but no errors either. The worst one, actually shown to be only connected at 3.0Gbps, had the following results:
ID# ATTRIBUTE_NAME FLAG VALUE WORST THRESH TYPE UPDATED WHEN_FAILED RAW_VALUE
1 Raw_Read_Error_Rate 0x002f 200 200 051 Pre-fail Always - 0
3 Spin_Up_Time 0x0027 204 157 021 Pre-fail Always - 4783
4 Start_Stop_Count 0x0032 100 100 000 Old_age Always - 221
5 Reallocated_Sector_Ct 0x0033 200 200 140 Pre-fail Always - 0
7 Seek_Error_Rate 0x002e 200 200 000 Old_age Always - 0
9 Power_On_Hours 0x0032 050 050 000 Old_age Always - 37005
10 Spin_Retry_Count 0x0032 100 100 000 Old_age Always - 0
11 Calibration_Retry_Count 0x0032 100 100 000 Old_age Always - 0
12 Power_Cycle_Count 0x0032 100 100 000 Old_age Always - 221
192 Power-Off_Retract_Count 0x0032 200 200 000 Old_age Always - 151
193 Load_Cycle_Count 0x0032 200 200 000 Old_age Always - 416
194 Temperature_Celsius 0x0022 112 093 000 Old_age Always - 38
196 Reallocated_Event_Count 0x0032 200 200 000 Old_age Always - 0
197 Current_Pending_Sector 0x0032 200 200 000 Old_age Always - 0
198 Offline_Uncorrectable 0x0030 100 253 000 Old_age Offline - 0
199 UDMA_CRC_Error_Count 0x0032 200 200 000 Old_age Always - 3
200 Multi_Zone_Error_Rate 0x0008 200 200 000 Old_age Offline - 0
Does that tell you anything?
Seems ok to me. I guess, the UDMA_CRC_Error_Count can indicate a possible (past) issue with the connection between the drive and the interface (caused by cable or the controller on the MB). Beyond that looks normal, but maybe somebody else has a better idea here.