Unknown internal error loading Web UI pages

Hello Rockstor developers and community,

I’ve been using Rockstor for over a year and it’s been mostly stable and useful :slight_smile: . First, I’m seeing the message when loading pages, such as the dashboard:
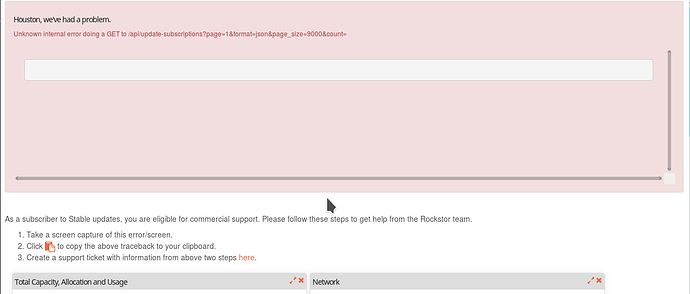
Unknown internal error doing a GET to /api/update-subscriptions?page=1&format=json&page_size=9000&count=

RocksStor UI pages are taking several minutes to load. When I usually noticed them taking 10 - 15 seconds at most.

I noticed that the message doesn’t show on the Rockon Web UI page. Although, the page still loads incredibly slow.

This is operating on a Supermicro X7DCL and two Intel(R) Xeon(R) CPU E5450 @ 3.00GHz

 total            used            free              shared     buff/cache   available
   Mem:       24687708     1733708    16291932       67740     6662068    22356856
   Swap:      12387324           0    12387324

System Volume is one drive:
Model Number: WDC WD1500AHFD-00RAR5

All other storage on a RAID-1 with drives:

Model Number: TOSHIBA MD04ACA500
Model Number: HGST HUS726060ALA640

procs -----------memory---------- ---swap-- -----io---- -system-- ------cpu-----
 r  b   swpd   free   buff  cache   si   so    bi    bo   in   cs us sy id wa st
 2  0      0 16264456   6360 6676484    0    0   101    90  202  296  1  3 95  1  0

The rockstor.log seem to just be filled errors about quota. Is this where the UI logs or is it another log? I’d be glad to send a more detailed report to support. But as a side note, the link in the message takes me to the page https://support.rockstor.com/open.php, which doesn’t open - error: Unable to connect.

Thank you in advance for advice.

[edit]
I tried installing a Rockon and tried installing it again, as steps to upgrade the image. The Rockon page is not loading after an update and giving the message:

Unknown internal error doing a GET to /api/pools?page=1&format=json&page_size=9000&count=

I’m getting something similar. and both samba and rockons seems not to start.

I’ve tried doing a scrub and reboot. I used the command “btrfs scrub start /dev/sda” to scrub each of the drives /dev/sda /dev/sdb /dev/sdc for me. I used btrfs scrub status /dev/sda to see that it completes the scrub and then reboot. The Web UI is still unfortunately throwing similar errors, e.g. bellow when loading the dashboard:

Unknown internal error doing a GET to /api/dashboardconfig

I’ve made sure quota was enabled for the pools and tried rebooting with no luck. Unfortunately the rockons are not coming back online now after a reboot. I’m deciding what my next move is because the Docker applications have become very important to me and the NAS is not so important ATM.

Sorry you’re both having issues… I’m not sure what the cause can be but I used to have similar system hanging issues a long time ago when I was using a small USB flashdrive as OS disk and it got close to full. It seems you’re running the OS on an HDD so the chances they’re running low on space are much lower I believe, but maybe it’s worth double checking…

Are these issues coincidental to any change on your systems?
Regarding logs, what I can think of would be the usual /opt/rockstor/var/log/rockstor.log, and / or journalctl, possibly when trying to open a new page or anything that you know errors out. Logs from the booting procedure might be informative as well.
I’m sorry I can’t directly help, but maybe we can get more info for the more knowledgeable crowd.

2 Likes

Thank you for the kind advice, Flox. I double checked the disk usage, and capacity doesn’t look to be the issue on my system.

Bellow shows the size of the two pools in this Rockstor instance:

Filesystem      Size  Used Avail Use% Mounted on
devtmpfs         12G     0   12G   0% /dev
tmpfs            12G     0   12G   0% /dev/shm
tmpfs            12G  8.8M   12G   1% /run
tmpfs            12G     0   12G   0% /sys/fs/cgroup
/dev/sdc3       128G  5.4G  121G   5% /
/dev/sdc3       128G  5.4G  121G   5% /home
/dev/sdc1       477M  139M  309M  32% /boot
/dev/sdb        5.1T  185G  4.4T   4% /mnt2/RAID1-A
/dev/sdc3       128G  5.4G  121G   5% /mnt2/rockstor_rockstor
tmpfs           2.4G     0  2.4G   0% /run/user/0
...
/dev/sdb        5.1T  185G  4.4T   4% /mnt2/A1-RockOns

Hopefully your advice help someone. I’m still searching. And looking for anything that could give more clues, I tried running the following script from /var/rockstor/bin which shows a possible network issue. But I haven’t installed any firewall manually over the base install. The only packages I recall installing may be vim, nmap, and netcat.

~ # ./bootstrap 
BTRFS device scan complete

Error connecting to Rockstor. Is it running?
Exception occured while bootstrapping. This could be because rockstor.service is still starting up. will wait 2 seconds and try again. Exception: HTTPConnectionPool(host='127.0.0.1', port=8000): Max retries exceeded with url: /api/commands/bootstrap (Caused by <class 'httplib.BadStatusLine'>: '')
Error connecting to Rockstor. Is it running?

Anyway, the rockstor service appears to be running. So I’m still searching ATM:

~ # systemctl status rockstor
● rockstor.service - RockStor startup script
   Loaded: loaded (/etc/systemd/system/rockstor.service; enabled; vendor preset: enabled)
   Active: active (running) since Sun 2018-09-23 16:49:58 PDT; 31min ago
 Main PID: 2984 (supervisord)
   CGroup: /system.slice/rockstor.service
           ├─ 2984 /usr/bin/python /opt/rockstor/bin/supervisord -c /opt/rockstor/etc/supervisord.conf
           ├─ 2995 nginx: master process /usr/sbin/nginx -c /opt/rockstor/etc/nginx/nginx.conf
           ├─ 2996 /usr/bin/python /opt/rockstor/bin/gunicorn --bind=127.0.0.1:8000 --pid=/run/gunicorn.pid --wor...
           ├─ 2997 /usr/bin/python /opt/rockstor/bin/data-collector
           ├─ 2998 /usr/bin/python2.7 /opt/rockstor/bin/django ztaskd --noreload --replayfailed -f /opt/rockstor/...
           ├─ 2999 nginx: worker process
           ├─ 3000 nginx: worker process
           ├─22505 /usr/bin/python /opt/rockstor/bin/gunicorn --bind=127.0.0.1:8000 --pid=/run/gunicorn.pid --wor...
           ├─29403 /usr/bin/python /opt/rockstor/bin/gunicorn --bind=127.0.0.1:8000 --pid=/run/gunicorn.pid --wor...
           └─29405 /sbin/btrfs fi show /dev/disk/by-id/ata-TOSHIBA_MD04ACA500_35OBK0EWFS9A

Sep 23 16:49:58 r2d2 supervisord[2984]: 2018-09-23 16:49:58,365 CRIT Server 'unix_http_server' running witho...cking
Sep 23 16:49:58 r2d2 supervisord[2984]: 2018-09-23 16:49:58,365 INFO supervisord started with pid 2984
Sep 23 16:49:59 r2d2 supervisord[2984]: 2018-09-23 16:49:59,368 INFO spawned: 'nginx' with pid 2995
Sep 23 16:49:59 r2d2 supervisord[2984]: 2018-09-23 16:49:59,370 INFO spawned: 'gunicorn' with pid 2996
Sep 23 16:49:59 r2d2 supervisord[2984]: 2018-09-23 16:49:59,371 INFO spawned: 'data-collector' with pid 2997
Sep 23 16:49:59 r2d2 supervisord[2984]: 2018-09-23 16:49:59,373 INFO spawned: 'ztask-daemon' with pid 2998
Sep 23 16:50:01 r2d2 supervisord[2984]: 2018-09-23 16:50:01,384 INFO success: data-collector entered RUNNING...secs)
Sep 23 16:50:01 r2d2 supervisord[2984]: 2018-09-23 16:50:01,384 INFO success: ztask-daemon entered RUNNING s...secs)
Sep 23 16:50:04 r2d2 supervisord[2984]: 2018-09-23 16:50:04,388 INFO success: nginx entered RUNNING state, p...secs)
Sep 23 16:50:04 r2d2 supervisord[2984]: 2018-09-23 16:50:04,388 INFO success: gunicorn entered RUNNING state...secs)
Hint: Some lines were ellipsized, use -l to show in full.

And strange enough, the port seems to be open. So perhaps it’s just not operating as needed:

~ # nmap -p 8000 -P0 127.0.0.1

Starting Nmap 6.40 ( http://nmap.org ) at 2018-09-23 17:30 PDT
Nmap scan report for localhost (127.0.0.1)
Host is up (0.000061s latency).
PORT     STATE SERVICE
8000/tcp open  http-alt

I’m turning on debugging and will reboot to look further at the logs:

~ # ./debug-mode on
DEBUG flag is now set to True

I’ll keep this post updated on any further details.

Searching for your bootstrap error on the forum, there’s a relatively old topic pinpointing an unexpected behavior by Docker.

As @HBDK mentioned running Rockons, I’m wondering whether you think this might apply to this topic.

That’s a good idea, Flox. I don’t really do image clean-up. I have not had much incentive because I have had plenty of space. Not sure what the exact method is from the forum post to clean up the images when the docker service is not starting. I see the post links to https://github.com/moby/moby/issues/9939 which is rather old, but still seems like some good information. I’ll be checking this out. Thx again, Flox.

@Horatio and @HBDK Hello again.

In addition to all that @Flox has said, it would also be useful to know your current installed Rockstor version:

yum info rockstor

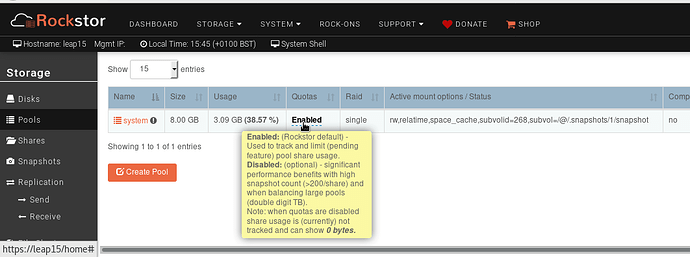
Also note that as of more recent Rockstor versions it is possible to disable quotas and maintain all current functionality bar share usage reports, this came in around 3.9.2-18 stable channel release although there have a few quota fixes / improvements since then. And we have a few to go at yet. Just a thought as if the pools are being dragged to a crawl due to quotas and many snapshots, disabling them, if the Rockstor version is new enough, might clear up some potential red herrings caused by simple time outs.

Most likely not the case as @Flox noted but it is worth knowing that for btrfs the ‘df’ disk free command is a little in the dark. Best to use:

btrfs fi usage /mnt2/pool-name

plus you could see if there is anything spinning away your processors with:

top

Although this again seems unlikely.

Hope that helps, if only just for more info.

Hi Philip, I was able to check on this again this morning and the rockon service has started. It has seemed to fixed some of the issue on it’s own. Although, the Web UI pages are still much slower than usual and getting errors on the page still.

That said, this is the current output from the volume usage as suggested:

~ # btrfs fi usage /mnt2/RAID1-A/
Overall:
    Device size:                  10.01TiB
    Device allocated:            378.06GiB
    Device unallocated:            9.64TiB
    Device missing:                  0.00B
    Used:                        374.52GiB
    Free (estimated):              4.82TiB      (min: 4.82TiB)
    Data ratio:                       2.00
    Metadata ratio:                   2.00
    Global reserve:              439.77MiB      (used: 0.00B)

Data,RAID1: Size:181.00GiB, Used:180.16GiB
   /dev/sda      181.00GiB
   /dev/sdb      181.00GiB

Metadata,RAID1: Size:8.00GiB, Used:7.11GiB
   /dev/sda        8.00GiB
   /dev/sdb        8.00GiB

System,RAID1: Size:32.00MiB, Used:48.00KiB
   /dev/sda       32.00MiB
   /dev/sdb       32.00MiB

Unallocated:
   /dev/sda        4.36TiB
   /dev/sdb        5.27TiB

And here is the version:

~ # yum info rockstor
Loaded plugins: changelog, fastestmirror
Loading mirror speeds from cached hostfile
 * base: centos.den.host-engine.com
 * epel: mirror.oss.ou.edu
 * extras: mirror.dal10.us.leaseweb.net
 * updates: mirror.dal10.us.leaseweb.net
Installed Packages
Name        : rockstor
Arch        : x86_64
Version     : 3.9.2
Release     : 39
Size        : 79 M
Repo        : installed
From repo   : Rockstor-Stable
Summary     : RockStor -- Store Smartly
License     : GPL
Description : RockStor -- Store Smartly

Also, I checked how many images exist while docker is currently running and don’t see an excessive amount, in the thousands.

~ # docker images | wc -l
104

Thx for all the thoughts. I’ll be pretty happy as long as docker is running and snapshots still work.

well my system still appears to be bricked.
there is no cpu load to speak of, the docker service was running but i can’t connect to any of the rockons.
if i try to navigate to a share using ssh it just hangs when i run LS.

my current version:

yum info rockstor
Loaded plugins: changelog, fastestmirror
Loading mirror speeds from cached hostfile
 * base: mirror.one.com
 * epel: mirror.infonline.de
 * extras: centos.mirror.iphh.net
 * updates: mirror.one.com
Installed Packages
Name        : rockstor
Arch        : x86_64
Version     : 3.9.2
Release     : 39
Size        : 79 M
Repo        : installed
From repo   : Rockstor-Stable
Summary     : RockStor -- Store Smartly
License     : GPL
Description : RockStor -- Store Smartly

the drive usage:

btrfs fi usage /mnt2/Main
Overall:
    Device size:                   7.28TiB
    Device allocated:              6.88TiB
    Device unallocated:          407.94GiB
    Device missing:                  0.00B
    Used:                          6.67TiB
    Free (estimated):            309.24GiB      (min: 309.24GiB)
    Data ratio:                       2.00
    Metadata ratio:                   2.00
    Global reserve:              512.00MiB      (used: 0.00B)

Data,RAID10: Size:3.43TiB, Used:3.33TiB
   /dev/sdc      878.00GiB
   /dev/sdd      878.00GiB
   /dev/sde      878.00GiB
   /dev/sdf      878.00GiB

Metadata,RAID10: Size:10.00GiB, Used:8.93GiB
   /dev/sdc        2.50GiB
   /dev/sdd        2.50GiB
   /dev/sde        2.50GiB
   /dev/sdf        2.50GiB

System,RAID10: Size:64.00MiB, Used:400.00KiB
   /dev/sdc       16.00MiB
   /dev/sdd       16.00MiB
   /dev/sde       16.00MiB
   /dev/sdf       16.00MiB

Unallocated:
   /dev/sdc      982.50GiB
   /dev/sdd      982.50GiB
   /dev/sde      982.50GiB
   /dev/sdf      982.50GiB

I’ve decided to back up the Rockstor and possibly deal with some manual restores. As some Rockons are running. Although, some are failing to start or just restarting ad infinitum. I have the following, if it helps with any clues. This may be an excessive amount of subvolumes or Rockons:

~ # btrfs subvolume list /mnt2/RAID1-A/ |wc -l
992

~ # docker ps -a |wc -l
21

Well, just to bring up something else interesting. After rebooting the output from docker is hanging or still processing after a few minutes here.

~ # docker ps

I’m still ready to restore. But might try something, if there are any thoughts.

I’ve been wondering whether snapshots could also be involved in why your system hangs, and your listing of a “relatively” high number of subvolumes (I’m not sure how many subvolumes is considered “high”) reinforces this thought in my head. Do you have many snapshots of shares? I remember seeing references to BTRFS being likely to hang with many subvolumes/snapshots:
https://btrfs.wiki.kernel.org/index.php/Gotchas#Having_many_subvolumes_can_be_very_slow

As a warning, remember not to delete snapshots of the Rockons-root share, as this will flat-out break the Rockons as nicely explained by @phillxnet here:

@HBDK

and @Horatio

I agree with @Flox these could all be snapshot / subvol count related in cohorts with quotas enabled.

Also, if attempting to reduce snapshot counts, that the delete of a snapshot is the expensive part. The creation is essentially free. So if your pools have ground to a halts, or near enough, just try disabling quotas, either via the Web-UI:

or via the command line if the Web-UI is misbehaving potentially due to ‘hangs’ caused by quota issues.

btrfs quota disable /mnt2/pool-name

Best turn off quotas first before attempting any share / snapshot removal, they are both subvolumes, as it’s a lot less expensive to do this when quotas are not enabled.

Hopefully this will help, and given you are both on > 3.9.2-18 all function, bar share size reporting, should work as expected.

Definitely worth a try I recon as many have reported vast speed ups with quotas disabled and I’ve had to do the same on an older pool I have here just to return it to ‘proper’ function. It would slow to a crawl and then ‘break’ associated things due to time outs. Bit frustrating but we are only moving forward with such things and there are many fixes awaiting us in this area, and others, as the btrfs devs are making great strides as time goes on.

Let us know how a quota disable works out before you try anything else as particularly the slow ‘ls’ report is a potential give away on this one, which in turn would hold up some docker images as well.

Also remember to try disabling quotas on the system pool as well, especially if you are using it for your Rock-ons-root, or other shares in number of with many snapshots.

so how many hours should i expect the disabling to take?

I had been restarting the docker service manually at the shell.

systemctl start docker.service

Seemed to come up but very slowly. Maybe about 24 minutes. I didn’t have quotas disabled at the time. Then I noticed the Rockons show up in the UI. Hope that helps.

Since docker was running, I used it’s commands to remove all docker dangling images, volumes, containers, and networks.

This left 633 subvolumes under /mnt2/RAID1-A/. After a reboot there were only three volumes shortly and then the 633 showed up.

There has not been any immediate benefit from the subvolume reduction. I’m still waiting 16 minutes now, for docker to show a process list.

Docker seems to be failing.

~ # systemctl status docker.service
● docker.service - Docker Application Container Engine
   Loaded: loaded (/etc/systemd/system/docker.service; enabled; vendor preset: disabled)
   Active: inactive (dead)
     Docs: http://docs.docker.com

Unfortunately, I’m not seeing any logs being generated by trying to manually start docker.

Term 1:
~ # journalctl -fu docker.service
– Logs begin at Tue 2018-09-25 15:48:11 PDT. –

Term 2:
# systemctl restart docker.service

Will follow up, if there is anything new.