Usage data on pools and shares not updated

I’m running RAID 1 and I have the same issue. Rockstor Dashboard shows zero usage on a share that has over 1TB of data in it. I don’t know what the problem is. It makes it difficult for me to tell when to add new drives to the array, I have to really keep track. I’m running the most current build, not using stable updates yet.

Some of the problems in this thread are unfortunately inherent to the use of btrfs. For example, output from the system commands df and du will generally be different from that of btrfsprogs btrfs filesystem df/du. The reason is that filesystem metadata, RAID levels and subvolumes all make the concept of “free space” much more complicated, also depending on whether you look at a whole filesystem or an individual share. The developers themselves explain this better in their FAQ section.

There is another issue with “zero usage” showing after making changes to a btrfs pool; this particular one can be resolved by performing btrfs quota rescan /path/to/pool.

At the moment, the usage reported for pools should be the most accurate. I’ve started an attempt to get a bit more sense into the share usage as well, with some changes to the shares list view in the most recent (3.8-14.10) version. Notably though, I haven’t touched the dashboard view yet. I’m keeping a list of current problems in this github issue:

Feel free to comment or contribute there as well.

3 Likes

Good enough! As long as there is somewhere I can find information about my space remaining, I’ll be able to get by. Share data doesn’t matter that much because there is no share size enforcement anyhow, so all I need to know is when to add more drives.

Is there any way to get the correctly reported size from the Pool page to show in the dashboard? That would be super helpful, even if it is only a temporary solution.

1 Like

That’s a good idea and shouldn’t be too hard, I’ll look into it.

Actually it should be possible to implement a finer grained size enforcement by making each share a subvolume and using btrfs’s quota groups, but that would require some more work.

Fantastic! Thanks. Please check in if that change works its way into a future patch.

I’ve submitted a pull request with the new dashboard widget:

If you want to test the changes even before they get accepted, you can download the two files to the proper location on your system, followed by:

# cd /opt/rockstor
# bin/buildout install collectstatic
3 Likes

That’s awesome! Thanks so much. This is a simple, but very helpful change until BTRFS is 100% functional on the reporting side of things.

Hi @sfranzen,
had a quick test on your pool widget and it seems ok, but here is my question:

What do you think about merging pool & share widgets together??? IMHO it could be better

Flyer/Mirko

Thanks for the zero usage fix.

This has made my dashboard show real / realistic values again :slight_smile:

Hey Mirko,

Well, I think several parts of the dashboard could do with some touch-ups; I just copy/pasted this thing together quickly to provide at least something. I’m currently looking at a suggestion from another user to do the dashboard in Patternfly. If that’s going to work, all widgets will have to be rewritten anyway.

Hi @sfranzen, can I assume you won’t move to Patternfly in the short time??
I think it can be quite easy (Patternfly made over Bootstrap, already running on Rockstor), but meanwhile I’m working on Dashboard widgets and this

Current dashboard crashes are because of D3.js library (not the library itself, but our use of it with 1 sec dynamic data updates on graphs) so I’m having some tests to move from d3.js SVG to chart.js canvas ( Nice post about SVG vs canvas & performance )

To check it, try this : https://jsfiddle.net/u5aanta8/29/ ( a little jsfiddle I’ve done to emulate Rockstor graphs, you can leave it open a long time without performance issues :slight_smile: )

Flyer

1 Like

@sfranzen Just chipping in here:

There is also an outstanding dashboard patch / enhancement by way of this pr:


Not sure if it’s really relevant if re-writes were planned but popping in here just in case.
I submitted it to partially repair some aesthetics I broke on a previous pr, some discussion in there also.
The approach there is a little fragile still, especially with long serial numbers, so might be best if that whole widget was re-thought anyway, ie only shows top 3 or 5 after patch depending on current widget size anyway.

@Flyer Name dropping you as I know you are already aware of this pr and as you indicate working in this area.

I know that the dashboard ‘as is’ takes a larger amount of client CPU than I would have thought necessary but I’m pretty green on js / web programming so might be a red herring.

@Flyer Yeah I won’t be in a hurry :wink:. I personally haven’t had this issue, but I did see there is a lot of hand-crafted SVG stuff in there. Glad there is a better method.

@phillxnet Well so am I :stuck_out_tongue:. My experience is mostly in C++/Qt as far as UIs go, but I thought I’d use rockstor as a tool to learn more about this.

@suman
even with the latest 3.9.0 release it seems that the data usage issue is still not solved (?)
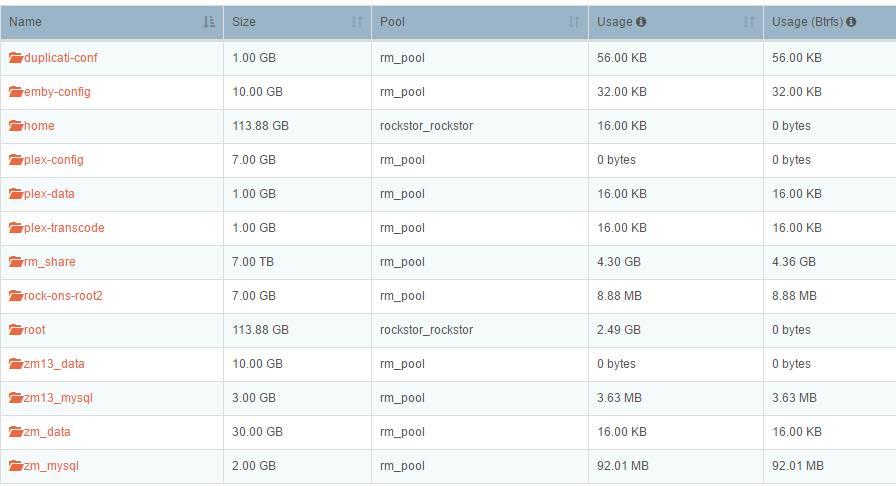
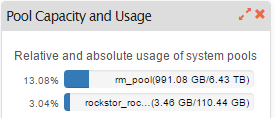
Almost all of belows indicated data usage is wrong (to less of MB/GB)

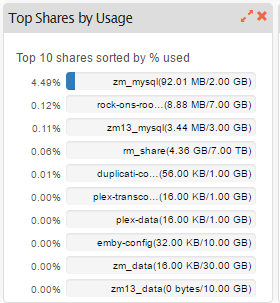
The only one that looks ok, seems this dashboard

Thanks for any comments

Hi Roland,
looking your screenshots there’s something I don’t understand :confused: :

rm_share has 4.30GB data + 4.36 GB for btrfs “overhead” so you should have a different top shares chart (overhead = light blue and current “real data” 4.30 GB dark blu)

Uhmm…did you update to latest Rockstor right now?? We had usage/btrfs usage on a previous code update and it seems ok

@suman & @phillxnet ?

Mirko

P.S.: waiting for 3.9.0 announcement :smiley:

@Flyer I’m using already 3.9.0 which has been released over night, automatically installed.

Yes, very strange screens on my machine

@phillxnet
Hi, any advice from a disk and file system expert? :wink:
See aboves threads…THX

@glenngould

Hardly: as it goes @Flyer is our ‘size reporting person’ (among many other talents), and has done a fair bit to get us closer to accurate reporting; including a rewrite of the dashboard since I was last on this thread. Best to look into btrfs commands to report disk and subvolume usages and paste the output here to give others more info to work with.

For example you could paste the output of:

btrfs fi usage /mnt2/zm_data

and

btrfs qgroup show /mnt2/zm_data

or any other subvolume name that is displaying much less usage than you expect.

That way we can have a look at where Rockstor’s use of equivalent commands is being ‘miss-reported’ in the user interface.

Thanks, sorry I can’t spend more time on this right now but as I know is the case with @Flyer as well, we are involved in other, also pressing issues. Please be patient as it is our intention to address this but their is obviously something a little strange with your figures that are not mirrored with our own installs. Can you tell us anything more about your current setup and it’s history, did you for example import this pool from a previous install, things like that might help to narrow down why your size reports are mis-reporting.

Hope that helps and if you could paste the output of those commands then maybe someone can see where Rockstor’s use of similar commands is going astray.

Cheers.

2 Likes

@phillxnet thanks for your prompt reply, in case you have a minute beside more pressing issues (understood) herewith the output as requested also for @Flyer

Looks strange to me “Warning: Raid56 detected, not implemented” including all the different sizes indicated below?

btrfs fi usage /mnt2/zm_data
WARNING: RAID56 detected, not implemented
Overall:
Device size: 10.92TiB
Device allocated: 0.00B
Device unallocated: 10.92TiB
Device missing: 0.00B
Used: 0.00B
Free (estimated): 0.00B (min: 8.00EiB)
Data ratio: 0.00
Metadata ratio: 0.00
Global reserve: 512.00MiB (used: 0.00B)

Data,RAID5: Size:996.00GiB, Used:987.79GiB
/dev/sdb 498.00GiB
/dev/sdc 498.00GiB
/dev/sdd 498.00GiB

Metadata,RAID5: Size:4.00GiB, Used:2.71GiB
/dev/sdb 2.00GiB
/dev/sdc 2.00GiB
/dev/sdd 2.00GiB

System,RAID5: Size:16.00MiB, Used:112.00KiB
/dev/sdb 8.00MiB
/dev/sdc 8.00MiB
/dev/sdd 8.00MiB

Unallocated:
/dev/sdb 3.15TiB
/dev/sdc 3.15TiB
/dev/sdd 3.15TiB

and

btrfs qgroup show /mnt2/zm_data
WARNING: qgroup data inconsistent, rescan recommended
qgroupid rfer excl


0/5 0.00B 0.00B
0/258 1.95MiB 14.20MiB
0/803 16.00EiB 16.00EiB
0/806 16.00KiB 16.00KiB
0/807 0.00B 6.84MiB
0/808 0.00B 6.95MiB
0/809 0.00B 7.02MiB
0/810 0.00B 7.02MiB
0/811 0.00B 7.02MiB
0/812 0.00B 7.00MiB
0/813 0.00B 7.31MiB
0/814 0.00B 7.31MiB
0/815 0.00B 7.31MiB
0/816 0.00B 7.30MiB
0/817 0.00B 7.27MiB
0/818 0.00B 6.33MiB
0/819 0.00B 6.33MiB
0/820 0.00B 6.33MiB
0/821 0.00B 8.94MiB
0/822 0.00B 8.95MiB
0/823 0.00B 8.94MiB
0/824 0.00B 8.94MiB
0/825 0.00B 8.97MiB
0/826 0.00B 8.97MiB
0/827 0.00B 8.97MiB
0/830 0.00B 4.44MiB
0/831 0.00B 4.44MiB
0/832 0.00B 4.47MiB
0/833 0.00B 4.47MiB
0/834 0.00B 3.83MiB
0/835 0.00B 4.52MiB
0/836 0.00B 4.52MiB
0/837 0.00B 4.52MiB
0/838 0.00B 4.52MiB
0/839 0.00B 4.52MiB
0/840 0.00B 4.52MiB
0/841 0.00B 4.47MiB
0/842 0.00B 7.17MiB
0/843 0.00B 7.23MiB
0/844 0.00B 7.25MiB
0/845 0.00B 7.25MiB
0/846 0.00B 7.25MiB
0/847 0.00B 7.25MiB
0/848 0.00B 7.25MiB
0/849 0.00B 7.25MiB
0/850 0.00B 7.25MiB
0/851 0.00B 7.33MiB
0/854 0.00B 4.47MiB
0/855 0.00B 4.47MiB
0/856 0.00B 4.47MiB
0/857 0.00B 9.45MiB
0/858 0.00B 9.45MiB
0/859 0.00B 9.45MiB
0/860 0.00B 9.44MiB
0/861 0.00B 9.45MiB
0/862 0.00B 9.41MiB
0/863 0.00B 9.44MiB
0/864 0.00B 9.42MiB
0/865 0.00B 9.45MiB
0/866 0.00B 9.45MiB
0/867 0.00B 9.47MiB
0/868 0.00B 9.47MiB
0/869 0.00B 9.47MiB
0/870 0.00B 18.27MiB
0/871 0.00B 18.27MiB
0/872 0.00B 18.27MiB
0/873 0.00B 18.27MiB
0/874 0.00B 18.34MiB
0/877 16.00KiB 16.00KiB
0/897 15.82MiB 15.82MiB
0/916 0.00B 8.92MiB
0/917 20.00KiB 20.00KiB
0/920 0.00B 7.31MiB
0/921 0.00B 7.31MiB
0/922 0.00B 7.31MiB
0/923 0.00B 13.59MiB
0/924 0.00B 13.61MiB
0/925 0.00B 13.62MiB
0/926 0.00B 13.61MiB
0/927 0.00B 176.00KiB
0/936 0.00B 0.00B
0/937 0.00B 0.00B
0/940 0.00B 128.00KiB
0/941 0.00B 128.00KiB
0/942 0.00B 736.00KiB
0/943 0.00B 752.00KiB
0/944 0.00B 752.00KiB
0/945 0.00B 752.00KiB
0/946 0.00B 752.00KiB
0/947 0.00B 752.00KiB
0/948 0.00B 752.00KiB
0/949 0.00B 752.00KiB
0/950 0.00B 752.00KiB
0/951 0.00B 752.00KiB
0/952 0.00B 720.00KiB
0/964 16.00KiB 16.00KiB
0/965 0.00B 0.00B
0/966 16.00KiB 160.00KiB
0/967 48.00KiB 48.00KiB
0/970 16.00KiB 16.00KiB
0/971 153.44MiB 48.00KiB
0/972 153.45MiB 48.00KiB
0/973 153.45MiB 48.00KiB
0/974 397.92MiB 192.00KiB
0/975 397.93MiB 48.00KiB
0/976 397.93MiB 48.00KiB
0/977 449.01MiB 80.00KiB
0/978 449.01MiB 80.00KiB
0/979 449.01MiB 80.00KiB
0/980 449.01MiB 80.00KiB
0/984 32.00KiB 32.00KiB
0/985 449.01MiB 192.00KiB
0/986 448.11MiB 32.76MiB
0/993 56.00KiB 56.00KiB
0/994 89.56MiB 48.00KiB
0/995 89.56MiB 48.00KiB
0/996 89.56MiB 48.00KiB
0/997 89.56MiB 48.00KiB
0/998 103.15MiB 96.00KiB
0/999 103.20MiB 112.00KiB
0/1000 410.30MiB 80.00KiB
0/1001 410.30MiB 80.00KiB
0/1002 410.30MiB 80.00KiB
0/1003 410.30MiB 80.00KiB
0/1004 410.30MiB 80.00KiB
0/1005 410.30MiB 80.00KiB
0/1006 410.30MiB 96.00KiB
0/1007 410.30MiB 80.00KiB
0/1008 410.30MiB 80.00KiB
0/1009 410.30MiB 80.00KiB
0/1010 465.27MiB 144.00KiB
0/1011 465.65MiB 96.00KiB
0/1012 467.12MiB 80.00KiB
0/1013 467.12MiB 80.00KiB
0/1014 467.12MiB 80.00KiB
0/1015 467.12MiB 80.00KiB
0/1016 467.12MiB 80.00KiB
0/1017 467.12MiB 80.00KiB
0/1018 467.12MiB 80.00KiB
0/1019 467.12MiB 128.00KiB
0/1020 502.91MiB 37.51MiB
0/1043 126.96MiB 48.00KiB
0/1044 126.96MiB 48.00KiB
0/1045 126.96MiB 48.00KiB
0/1047 7.32MiB 7.32MiB
0/1048 0.00B 0.00B
0/1049 127.33MiB 208.00KiB
0/1050 135.59MiB 96.00KiB
0/1051 121.82MiB 48.00KiB
0/1052 121.82MiB 48.00KiB
0/1053 121.82MiB 48.00KiB
0/1054 121.82MiB 48.00KiB
0/1055 121.86MiB 104.00KiB
0/1056 205.09MiB 80.00KiB
0/1057 205.09MiB 80.00KiB
0/1058 205.09MiB 80.00KiB
0/1059 205.09MiB 80.00KiB
0/1060 205.09MiB 80.00KiB
0/1061 205.09MiB 80.00KiB
0/1062 205.09MiB 80.00KiB
0/1063 205.09MiB 80.00KiB
0/1064 205.09MiB 80.00KiB
0/1065 205.09MiB 80.00KiB
0/1066 205.16MiB 176.00KiB
0/1067 1.33GiB 80.00KiB
0/1068 1.33GiB 80.00KiB
0/1069 1.33GiB 144.00KiB
0/1070 572.00KiB 572.00KiB
0/1071 112.00KiB 32.00KiB
0/1072 352.00KiB 128.00KiB
0/1074 944.00KiB 272.00KiB
0/1075 1.64MiB 96.00KiB
0/1076 1.95MiB 832.00KiB
0/1078 126.96MiB 48.00KiB
0/1079 126.98MiB 48.00KiB
0/1080 126.98MiB 48.00KiB
0/1081 319.18MiB 80.00KiB
0/1082 319.18MiB 80.00KiB
0/1083 319.18MiB 96.00KiB
0/1084 326.48MiB 80.00KiB
0/1085 326.48MiB 80.00KiB
0/1086 326.48MiB 80.00KiB
0/1087 326.46MiB 128.00KiB
0/1088 326.48MiB 96.00KiB
0/1089 326.48MiB 96.00KiB
0/1090 326.48MiB 80.00KiB
0/1091 326.48MiB 80.00KiB
0/1092 326.48MiB 80.00KiB
0/1093 326.48MiB 80.00KiB
0/1094 326.48MiB 80.00KiB
0/1095 326.48MiB 80.00KiB
0/1096 326.48MiB 80.00KiB
0/1097 326.48MiB 80.00KiB
0/1098 326.48MiB 80.00KiB
0/1099 326.48MiB 80.00KiB
0/1100 338.37MiB 96.00KiB
0/1101 338.37MiB 112.00KiB
0/1102 369.03MiB 112.00KiB
0/1103 369.03MiB 80.00KiB
0/1104 369.03MiB 80.00KiB
0/1105 369.03MiB 80.00KiB
0/1106 369.03MiB 80.00KiB
0/1107 369.03MiB 80.00KiB
0/1108 369.03MiB 80.00KiB
0/1109 462.80MiB 160.00KiB
0/1110 466.83MiB 128.00KiB
0/1111 466.83MiB 96.00KiB
0/1112 466.83MiB 112.00KiB
0/1113 470.46MiB 80.00KiB
0/1114 470.46MiB 80.00KiB
0/1115 470.46MiB 80.00KiB
0/1116 552.80MiB 80.00KiB
0/1117 552.80MiB 80.00KiB
0/1118 552.80MiB 80.00KiB
0/1119 552.80MiB 80.00KiB
0/1120 0.00B 0.00B
0/1121 0.00B 0.00B
0/1122 0.00B 0.00B
0/1123 0.00B 0.00B
2015/1 16.95MiB 16.95MiB
2015/7 16.00EiB 16.00EiB
2015/10 16.00KiB 16.00KiB
2015/11 16.00KiB 16.00KiB
2015/12 15.82MiB 15.82MiB
2015/13 16.00KiB 16.00KiB
2015/14 0.00B 0.00B
2015/15 32.00KiB 32.00KiB
2015/16 56.00KiB 56.00KiB
2015/17 7.32MiB 7.32MiB
2015/18 0.00B 0.00B

1 Like

There might be still a bug in this closed issue ? or anything else is going on here in general or just on my machine :confused: