the command (if it works) would probably look something like this:
liquidctl initialize --direct-access
the command (if it works) would probably look something like this:
liquidctl initialize --direct-access
coming to think of it, this might be related to apparmor (toolset to provide granular permission profiles for apps to ensure they only do/read/write what they’re allowed to).
If that is the case, then it might require an installation of the apparmor-utils to be able to change the liquidctl apparmor profile from enforce to e.g. complain which could give you access to the device. then you can figure out how to update the apparmor profile, so it can still be set to enforce.
But, that’s just another guess …
Nope, this didnt work. Will try your other commands soon and report back. If that fails too, then I will just switch out the device to a commander pro that isnt labelled broken.
Also, for the commander pro I think kernel support has been added (https://www.phoronix.com/news/Corsair-Commander-Pro-Linux-5.9).
If that’s correct, my understanding is that you might be able to just use the fancontrol available with the lm-sensors package - in Opensuse that package is sensors (so zypper in sensors). You can run a sensor-detect and see whether the commander unit’s fans are visible. If yes, then you can go investigate how to set up the fancontrol portion
Hello all,
Some updates, will start will the positives. I’ve got the pools and shares set up now. So, I can transfer file and backups from my windows PCs to Rockstor’s RAID drives (6 of the 8TB drives) that are in RAID 10 config. I have also enabled Rock-Ons but have not looked into it too deeply. I plan on setting up a jellyfin server and qbittorent soon.
While it would be nice if I could see the Rockstor NAS as a computer of device on the “Networks” folder in Windows 10/11 PCs but its not a bit deal for me because I can use the "RUN \{ip address of Rockstor NAS} " to access the shares. While researching this, I came across a Rock-Ons named WSDD (https://hub.docker.com/r/kosdk/wsdd) and I installed it, configured the HOST_Name as my admin user for RockStor and set the WORKGROUP as the same as the workgroup of all my Windows PCs (All my Windows PCs are on the same workgroup and can see each other on the Network page). As i said, this isnt really a problem for me, but it would be nice if I could get Rockstor NAS to show up on Windows Network folder.
On a slightly different issue, I keep on seeing this blinking update notification (looks like RSS logo) on Rockstor dashboard all the time. I click on it and it tells me updates are available and list a bunch of packages of kernels and nividia. I click on the update packages and then the UI asks me to confirm if the updates should be installed and i hit okay, after that, the dialog box goes away and the update icon keeps blinking saying updating all package. However, nothing really updates. It keeps on blinking for hours and if i clink on the blinking icon again after a few hours, it tells me that updates are available and lists the same packages of kernels and nividia that was listed before. Is this suppose to behave this way and is this something that I need to be concerned about? I mean everything is working okay and it shows my nividia driver version to be the current one as per nividia’s page
Now coming to the liquidct issues, and to summaries-still now luck. Here is a list of stuff that I tried:
apparmor-utils , verified the liquidclt profile was running using aa-status | grep liquidctl and saw 3 listed profiles shown below /snap/liquidctl/current/usr/bin/liquidctl
snap-update-ns.liquidctl
snap.liquidctl.liquidctl
/var/lib/snapd/apparmor/profiles/snap.liquidctl.liquidctl to include the following lines to give permission:# Declare variables
@{HOME} = /home/*
@{pid} = [0-9]*
@{run} = /run
@{multiarch} = /usr/lib/x86_64-linux-gnu
@{etc_ro} = /etc
@{homedirs} = /home/*
# Profile for liquidctl
/snap/liquidctl/current/usr/bin/liquidctl {
# Include common abstractions
#include <abstractions/base>
#include <abstractions/nameservice>
#include <abstractions/user-tmp>
# Allow access to USB devices
/dev/bus/usb/** rw,
/sys/bus/usb/devices/** r,
/sys/devices/** r,
# Allow access to specific USB device by idVendor and idProduct
/sys/bus/usb/devices/usb*/idVendor r,
/sys/bus/usb/devices/usb*/idProduct r,
/sys/bus/usb/devices/usb*/power/control rw,
# Allow access to I2C devices
/sys/bus/i2c/devices/** r,
/sys/bus/i2c/devices/**/name r,
/sys/bus/i2c/devices/**/power/control rw,
# Allow necessary capabilities
capability net_admin,
capability sys_admin,
capability sys_rawio,
}
I can see the Commander Pro listed when I run lsusb
So far, none of this works. When i run the command liquidctl list I get the following error:
PermissionError: [Errno 13] Permission denied: '/sys/bus/i2c/devices'
Regarding @Hooverdan last post about commander pro being supported in Linux and not needing liquidclt; That looks like a good option but I dont know what commands to use to get it to work. So, maybe help me out by typing out and listed what commands to use if possible, please. After reading your post, I was able to install sensor packages using zyupper; but I dont know how to use the fancontrol stuff.
Looking forward to learning more about getting things to work in Linux, I’m having a good time and I hope I’m not being too much of a pain for all the Linux experts out there.
Glad to see you had some success in setting things up.
As for the wsdd setup
I’m not entirely sure, you did set up the Rockon and it’s running, but the server is still not showing on the network?
The host name should be the name of your Rockstor server that you assigned during the initial setup, not your admin user.
Did you select an update channel for Rockstor? If you have not, you should. I would assume you would select the Testing channel for now, until you might go for a subscription.
Not sure what other reasons there could be why the updates don’t seem to work through the WebUI. You can also update via the CLI.
Put yourself into elevated command prompt again su - and then run
zypper refresh && zypper up --no-recommends
confirm the list of packages for install with Y and then see whether that works. If not, you will likely get to see some error messages that might help identify what’s not working.
Sorry about the liquidctl issues you keep running into, I still suspect this is an apparmor issue, but I am not familiar enough with it that I can help you there (it is a Rockstor forum after all ![]() )
)
Install the sensors package as mentioned above. And then you can look at the development on github which includes fancontrol
And from the install file, perform the detection:
Here’s a wiki (maintained for arch linux, but still valid in settings, etc.):
https://wiki.archlinux.org/title/Fan_speed_control
That should get you started. You might also be able to find a tutorial on that elsewhere, e.g.:
or
or there are some videos on YouTube as well.
I abandoned liduiqctl as its way to complicated and I’m too dumb to figure it out. I looked into all your instructions on getting fan controls set up with lm-sensor package. I got that package installed and got sensors-detect but then things for complicated with pwmconfig. So, long story short, I decided to control my fans with the BIOS as that seemed the least complicated. I was able to set a fan curve which isnt as good and as quiet but it will work for the time being till I become more competent with Linux.
Regarding the updates issue, your instructions helped and i was able to fix the issue using zypper refresh && zypper up --no-recommends
Yes, this is the problem. Rockon is running and I’ve installed wsdd and that is running and configrued as well and its configured correctly from what i can tell. Host_Name is the name of this server (Rockstor-NAS) and the Workgroup is the same as Workgroup used by all other windows machines in my network. I dont know if this is a Windows issue or SMB/Samba issues with windows 11. While Network Discovery and File and printer share are also turned on for all windows machines. I do not have SMB1.0/CIFS File Sharing Support enabled at the moment, only SMB Direct is enabled in my Windows 11 machine, maybe that could be an issue. I will look into this further and report back soon.
I also want to use a few Rockons like qbittorrent and jellyfin. Does this involve a lot of command line work or are these faily simple to set up? I would like to give it a shot trying to get these services up and running if you think its possible for a newbie to do so.
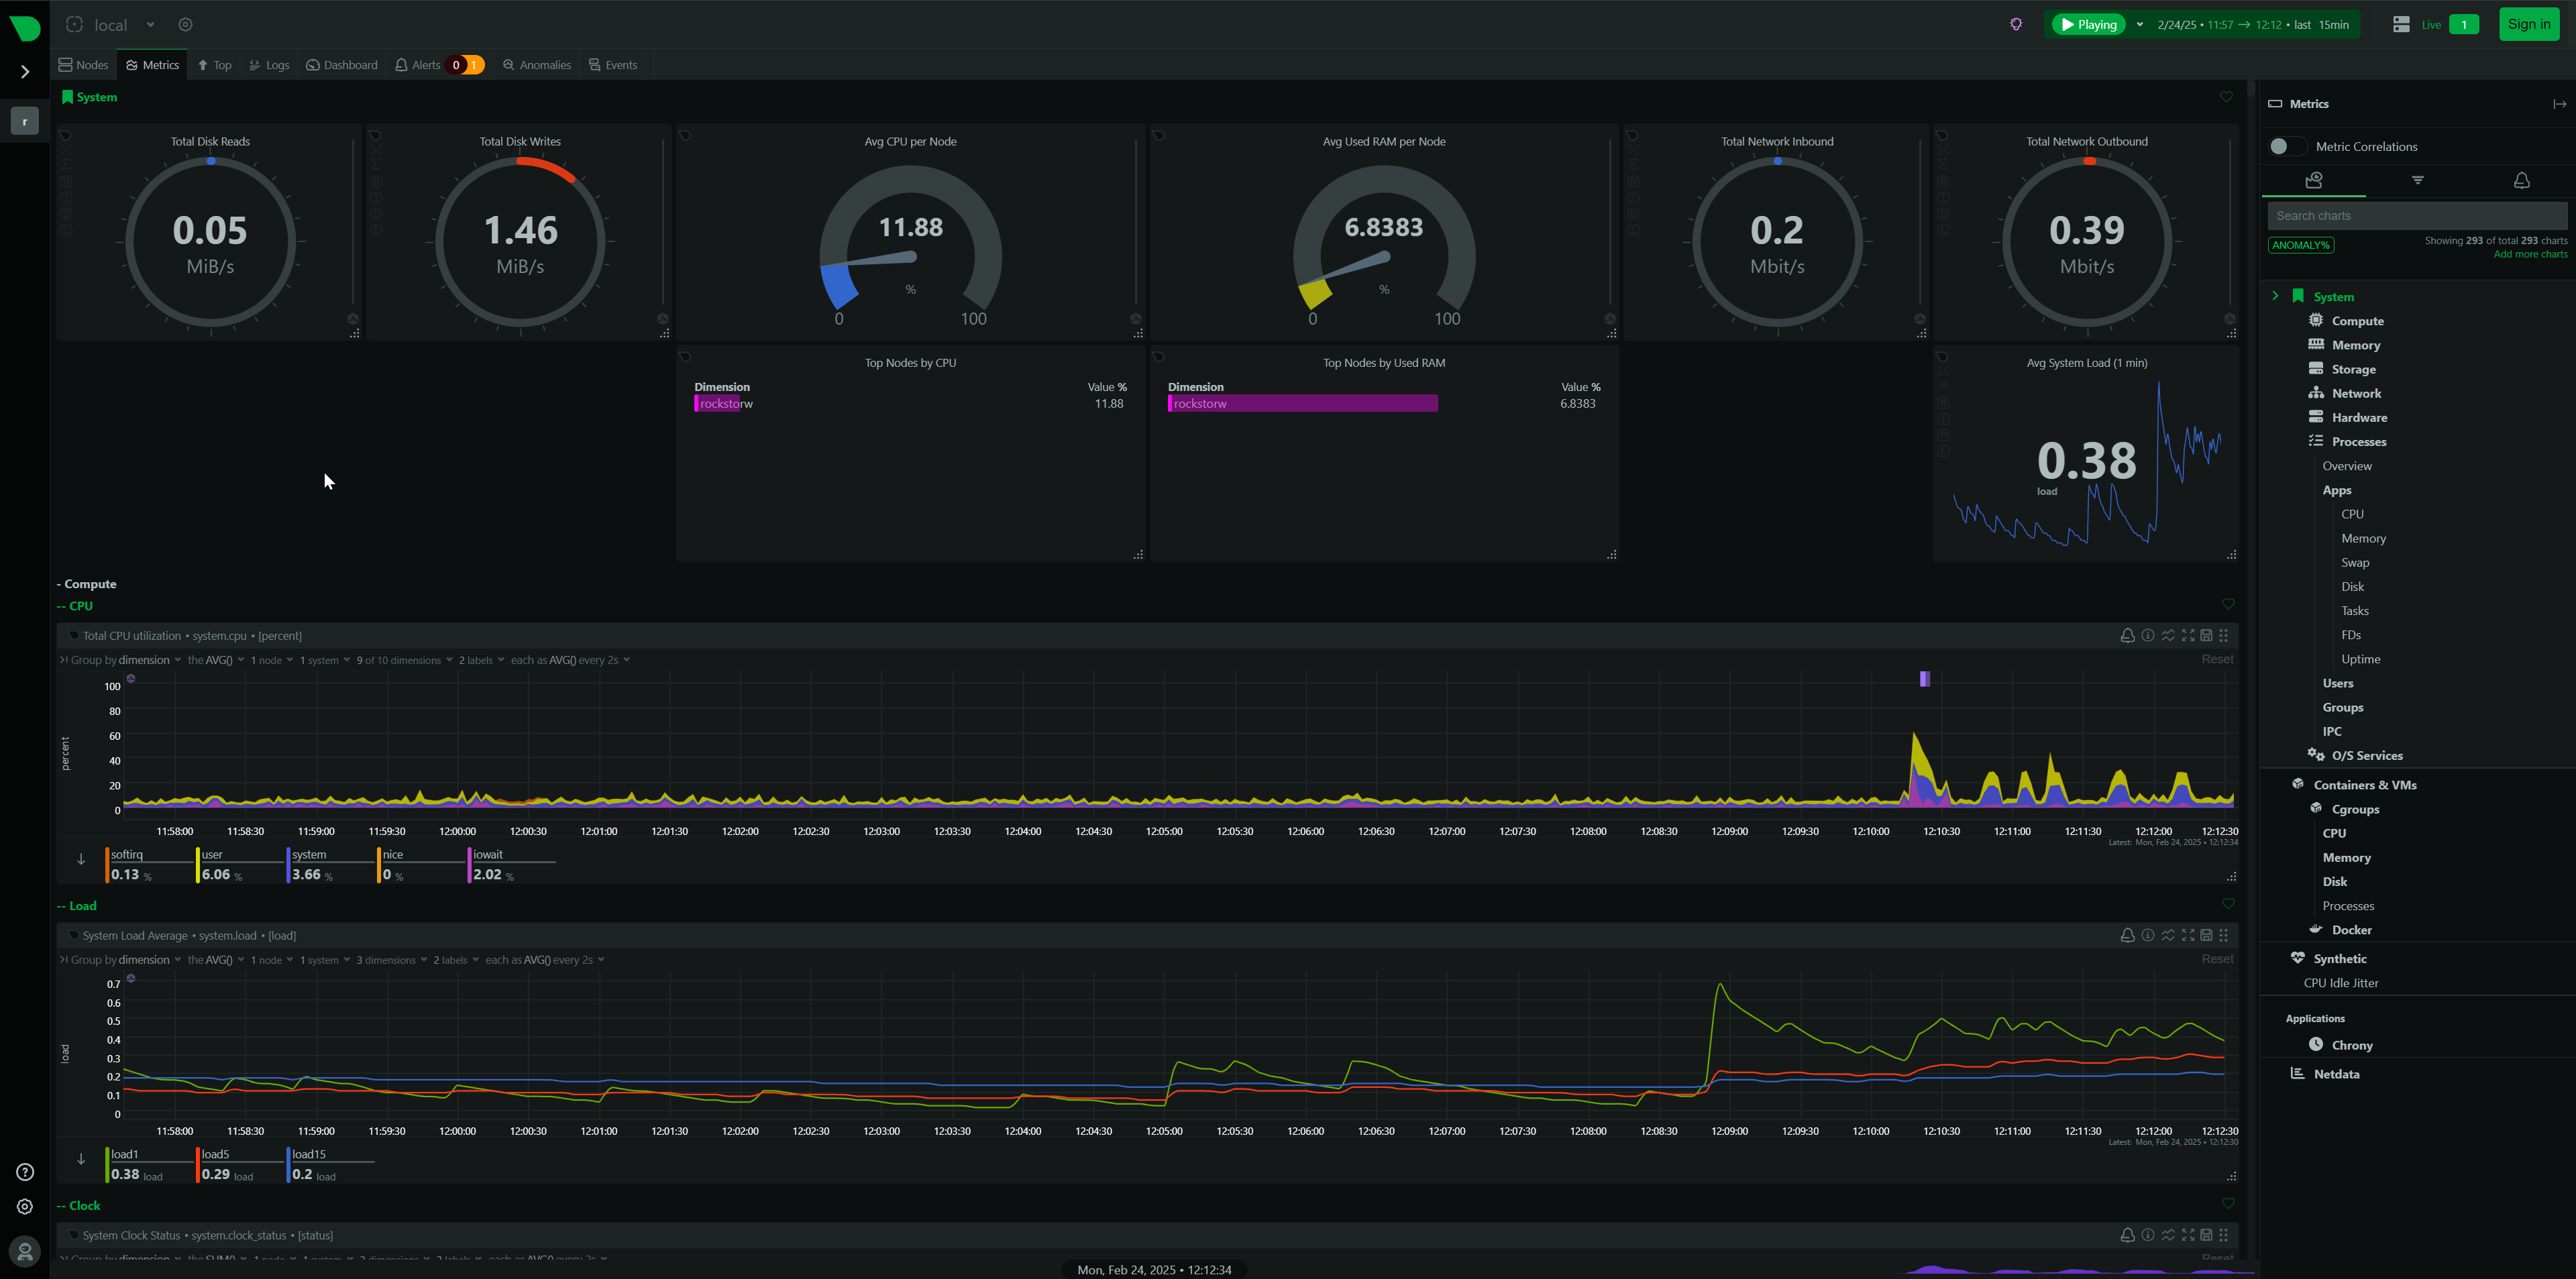
Also, I was looking into getting a widget for my dashboard that would show me the temps of my disks and I came across a post of a user here using Netdata that has a cool UI showing his CPU temps. I was wondering how to get Netdata to work for show CPU, GPU and HDD S.M.A.R.T temps as shown here CPU temperature
Thanks a lot for all the help ![]()
I was looking to the issue of Rockstor-NAS not showing up in the “Networks” folder and it seems like a windows 11 issue, but I cant identify what the issue is. The Rockstor-NAS is running Rockon WSDD and it has correct config for Host_name and Workgroup.
I was checking all my windows machines; total of 5 PCs.
PC1 & 2 → CAN see Rockstor-NAS in “Networks”, PC runs Windows 10 pro 22H2 (OS Build 19045.5487)
PC 3->CAN see Rockstor-NAS in “Networks”, PC runs Windows 7 SP1 (64-bit)
PC 4-> CANNOT see Rockstor-NAS in “Networks”, PC runs Windows 11 pro 24H2 (OS Build 26100.3194); But I can access the NAS and file shares using run command \Rockstor-NAS\
PC 5-> CANNOT see Rockstor-NAS in “Networks”, PC runs Windows 11 Home 23H2 (OS Build 22631.4890); But I can access the NAS and file shares using run command \Rockstor-NAS\
All 5 systems above have the following windows features enabled: SMB 1.0/CIFS File Sharing Support, SMB Direct, Telnet Client. Also, all clients can access the NAS and file shares using run command \Rockstor-NAS\
Got any ideas on what is happening with windows 11 that prevents the Rockstor-NAS from showing up in Networks?
Surprised that you Win11 Pro PC can’t see it. I have one running with the same version 24H2 (Build 26100.3194) and it can see it in “Networks”.
You should not need to use the SMB 1.0/CIFS File Sharing Support settings (since that’s fairly unsafe and turned off by default in Windows these days), though you probably have a different requirement to use it for. I have SMB direct turned on and the visibility in Networks is fine.
I assume, on the Win11 Pro PCs “network discovery” for the respective network connection is turned on. I know, dumb question, but I figure I’d ask ![]()
Only other thing I can think off is that may be a firewall is blocking some ports. I think for wsdd you need to have ports 3702 (udp) inbound and outbound as well as 5357 (tcp).
Yes, you should be able to set those up without much command line (if any) work.
@Flox contributed the latest version of Netdata as a Rockon. the setup is dirt simple, and then you should have most data available in the default provided dashboards:
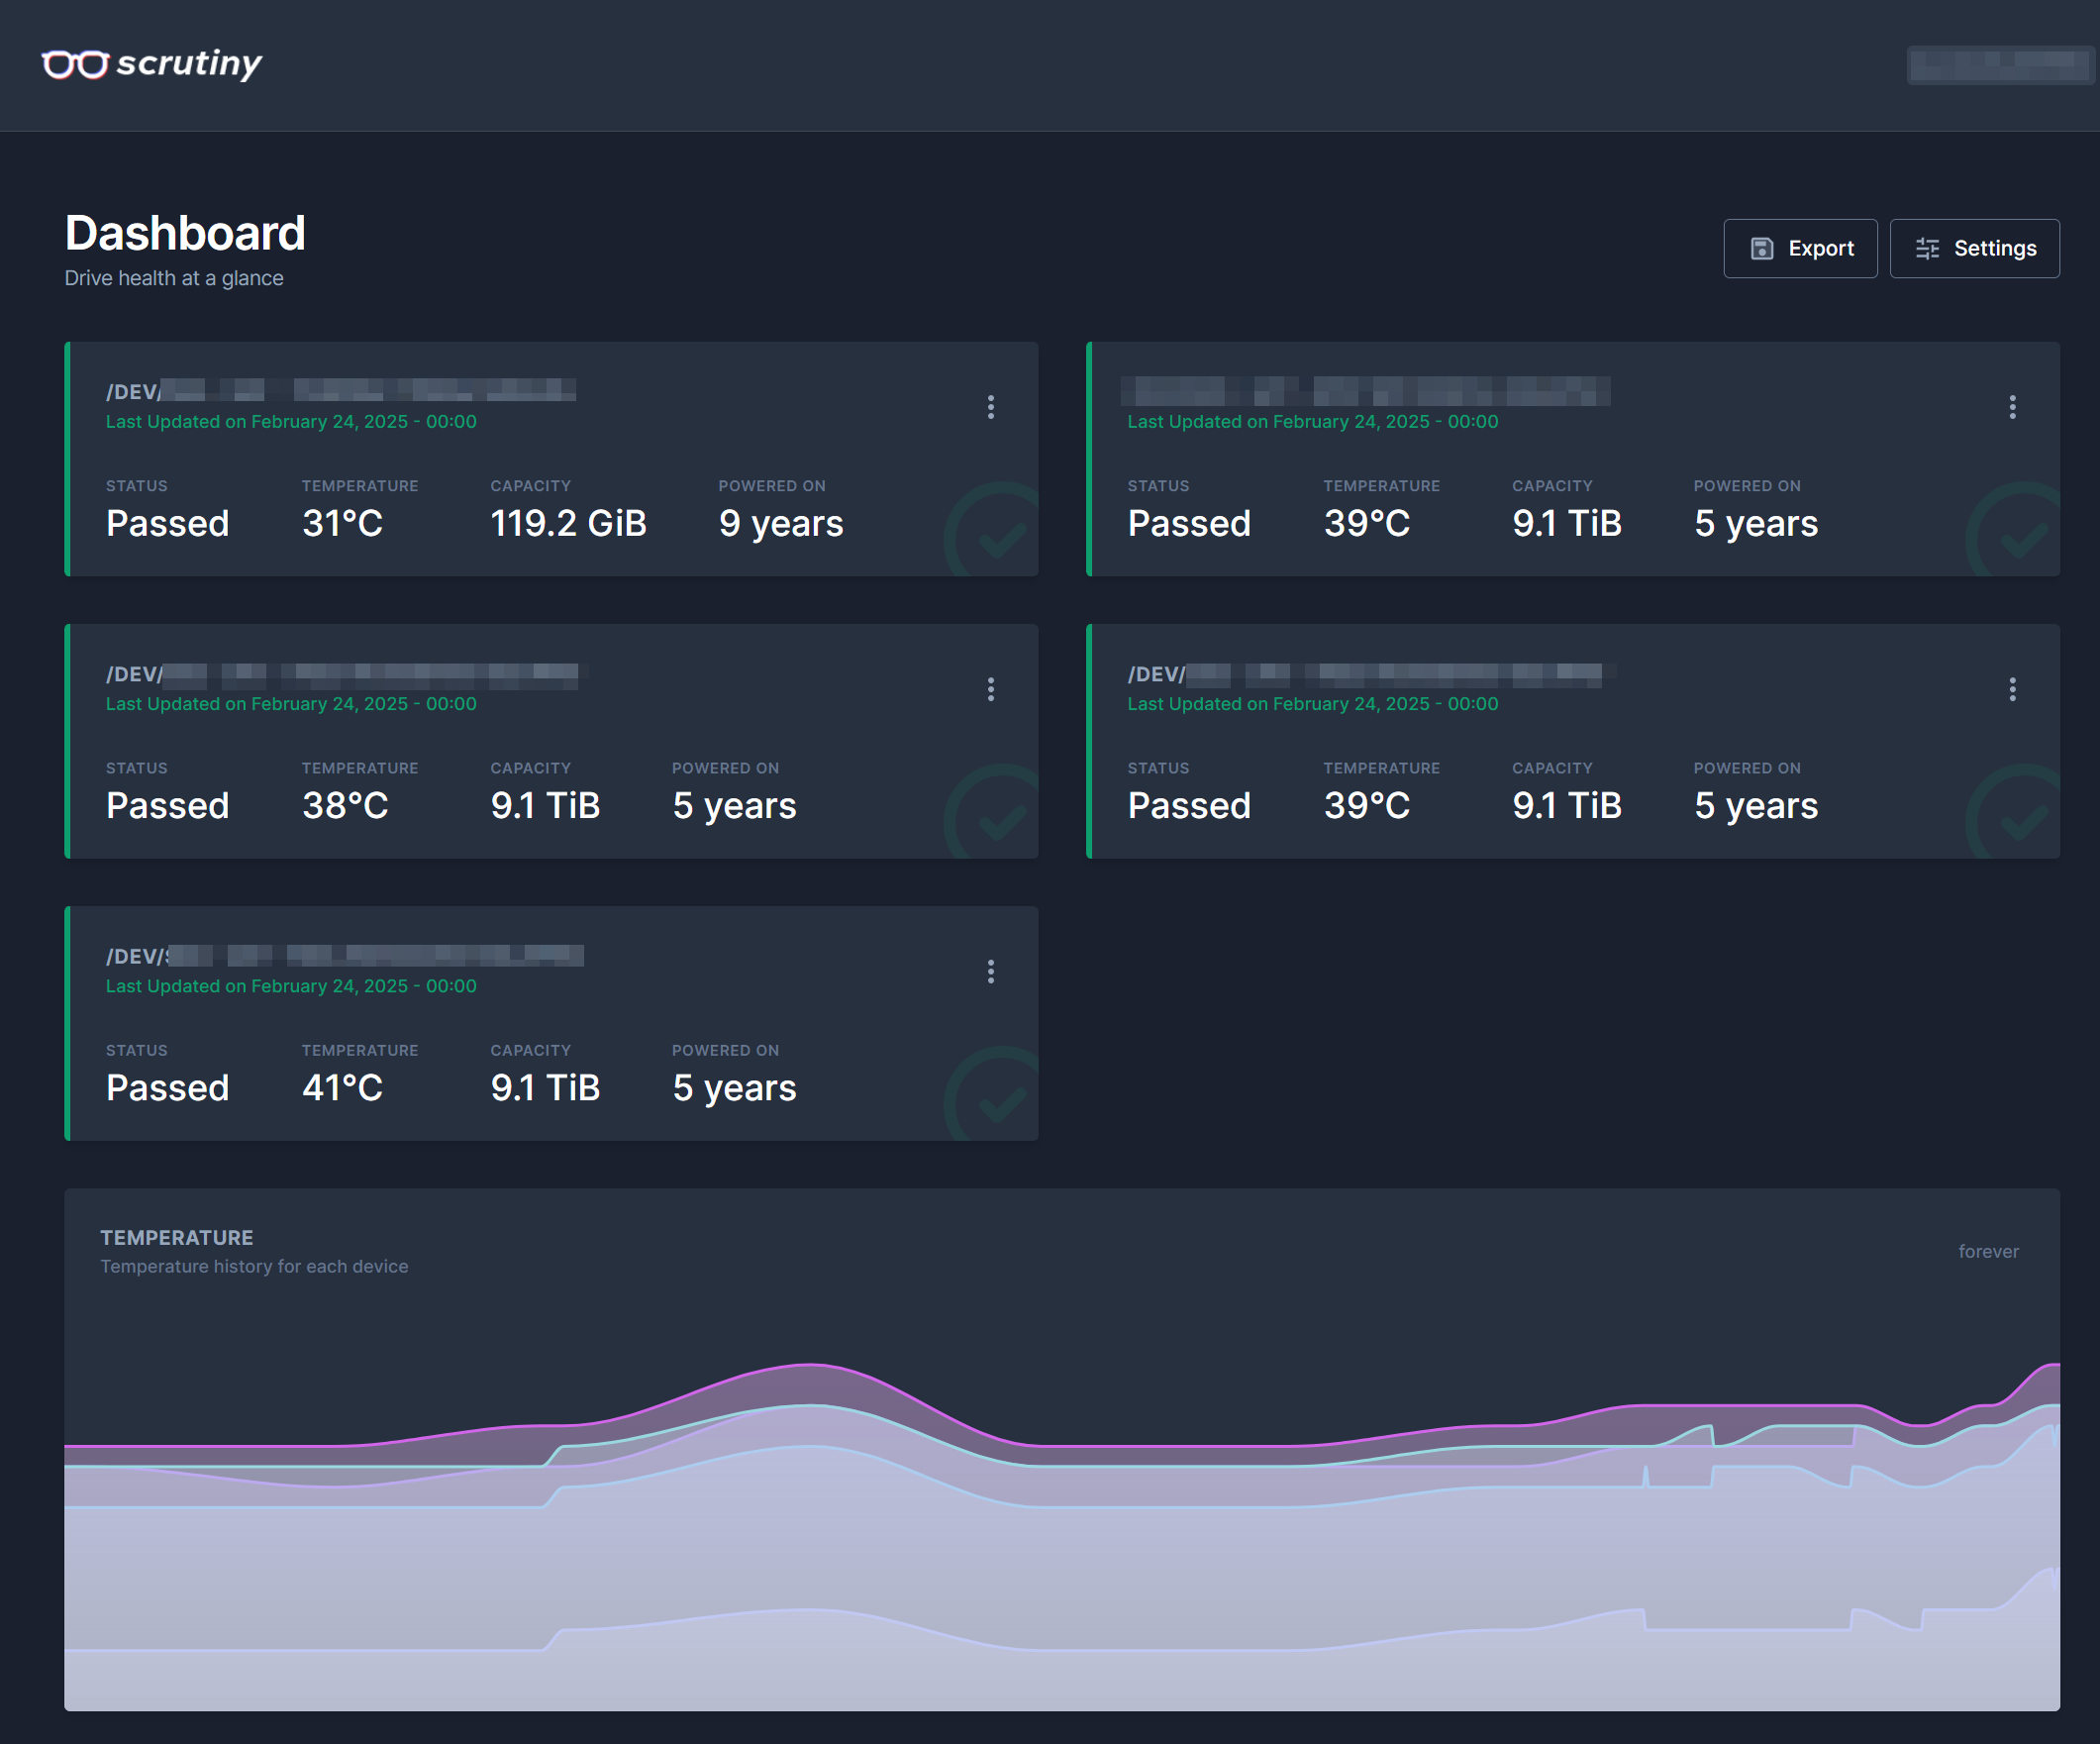
For the HDD S.M.A.R.T info there is another Rockon available, which takes a SMART snapshot every day, so you can see changes over time (including HDD temperature) - It’s the Scrutiny Rockon.
Yup, Network Discovery is ON for the connection. It can see every other device on my network including the other windows 10 and 11 home machines. Yes, this is very strange behaviour; but honestly, its okay. I can access the NAS by \{ip address}
Will give this a try; will add 2 incoming and 2 outgoing ports as you said and will report back.
I installed Scrutiny and it works perfectly and this is exactly what I wanted. Thank you very much.
I also installed Netdata rockon and ran into an issue when trying to log into the Netdata Web UI. I tied to sign in using my github account and the Web UI asked to paste a private key generated in the netdata_random_session_id. It asked to enter the command sudo cat /var/lib/netdata/netdata_random_session_id but i got an error saying “No Such file or directory”
I check the directory and there is no Netdata file/folder in /var/lib How do i find this netdata_random_session_id file to copy the private key?
I’m however able to login to Netdata Web UI anonymously. But the problem with anonymously login is that I cannot add sensors and hddtemp charts
I’ve been using it mostly anonymously. I assume, the command needs to be run inside the container, since no storage share is exposed. So, at the command line (still assuming you are using the WebUI command shell):
su -

docker exec -it netdata_official /bin/bash
This will get you inside the container, where you now can probably run the above command:
cat /var/lib/netdata/netdata_random_session_id
which will give you something like this:
e1871938-2619-44c4-8bac-a2e3bfc4cf38
you won’t need sudo in this case, because you’re already “placed” inside the container as the root user via the above docker command.
Yup, your command for running it inside the container worked perfectly and I was able to sign in to Netdata and get it working. I’ve customized my own dashboard and I’m loving all the graphs. Its perfect for monitoring my NAS remotely.
I was looking at getting S.M.A.R.T info to show up on Netdata but it seems like Netdata Rockons is unable to see the S.M.A.R.T data from smartctl package. I’ve installed smartctl package and its running correctly since i get see the S.M.A.R.T parameter for my device using the command smartctl -H /dev/sda I restarted the Netdata Rockon but still no luck, it doesnt see the smartctl parameters.
I was researching this online and I came across this page (https://S.M.A.R.T) that says I need to give SYS_RAWIO capability to the docker. I tried running that command on terminal and I got an error saying invalid reference format
Any idea how I can check if SYS_RAWIO capability is given to the Netdata docker or what command i can do to add this capability to the docker? I need to add six devices (sda, sdb, sdc, sdd, sde, sdf)
Unfortunately, that won’t be possible with the current Rockon definition.
The capability needs to be added in the definition:
--cap-add=SYS_RAWIO
which the Scrutiny Rockon has, but the Netdata Rockon does not.
If you do want to test this, you could create a custom Rockon definition (where to place it, etc. is described here) and use the below as the definition:
{
    "Netdata (Test)": {
        "containers": {
            "netdata_test": {
                "image": "netdata/netdata",
                "launch_order": 1,
                "opts": [
                    [
                        "--cap-add=SYS_PTRACE",
                        ""
                    ],
                    [
                        "--cap-add=SYS_RAWIO",
                        ""
                    ],
                    [
                        "--security-opt",
                        "apparmor=unconfined"
                    ],
                    [
                        "--net=host",
                        ""
                    ],
                    [
                        "-v",
                        "/var/run/docker.sock:/var/run/docker.sock"
                    ],
                    [
                        "-v",
                        "/proc:/host/proc:ro"
                    ],
                    [
                        "-v",
                        "/sys:/host/sys:ro"
                    ],
                    [
                        "-v",
                        "/etc/os-release:/etc/os-release:ro"
                    ]
                ],
                "ports": {
                    "19999": {
                        "description": "Port used to access the webUI port. MUST be 19999.",
                        "host_default": 19999,
                        "label": "webUI port",
                        "ui": true
                    }
                },
                "environment": {
                    "PGID": {
                        "description": "GID of the 'docker' group. See System - Identity - Groups in Rockstor's UI to find it.",
                        "label": "PGID",
                        "index": 1,
                        "default": 472
                    }
                }
            }
        },
        "description": "Netdata is a scalable, distributed, real-time, performance and health monitoring solution for Linux, FreeBSD and MacOS.<p>Out of the box, it collects 1k to 5k metrics per server per second. It is the corresponding of running top, vmstat, iostat, iotop, sar, systemd-cgtop and a dozen more console tools in parallel. netdata is very efficient in this: the daemon needs just 1% to 3% cpu of a single core.</p><p>Based on the official docker image: <a href='https://hub.docker.com/r/netdata/netdata' target='_blank'>https://hub.docker.com/r/netdata/netdata</a>, available for amd64 and arm64 architecture.</p>",
        "icon": "https://github.com/firehol/netdata/blob/master/web/images/seo-performance-64.png",
        "more_info": "See <a href='https://learn.netdata.cloud/' target='_blank'>https://learn.netdata.cloud/</a> for more info.",
        "website": "https://www.netdata.cloud/",
        "ui": {
            "slug": ""
        },
        "version": "1.0t"
    }
}
Once you’ve placed the file it in the rockons-metastore and run a refresh in the WebUI, you should be able to see this as “Netdata (test)”. I have not tested the above. If it doesn’t work, it might require the container to run in privileged mode (like Scrutiny does), but let’s see how far you get with this.
And if that does indeed work, then this can maybe submitted to the github repository as new iteration of the netdata (official) Rockon.
Hello,
What you said about making a new custom Rockon seems pretty complicated for someone like be. I will have to do a lot of reading and learning but I’m definitely going to give it a shot and I shall report back and let you know what issues I come across and how it all turns out. Allow me some time to get it done and get back to you.
Regarding some of the past things we discussed:
I added the following rules in my Windows 11 Pro machine:
Still CANNOT see the Rockstor-NAS in Network View in Windows 11 Pro, but is accessible using run \\Rockstor_NAS\ From what I can tell, it seems like a Windows 11 issue but I have no clue what it is.
I installed Transmission Rockon and got it running well, able to access the bittrorrent client using the Transmission Remote GUI and was able to transfer all the torrents from my old bittorrent client to the Rockon; got port forwarding working and all torrents are seeding at max speed.
Also, was trying to install the Jellyfin Rockon and during the installation process, the Rockon asked for a setting for hardware encoding device and I wasnt sure what to put there so I cancelled the installation. I was hope to learn about this from the forum first.
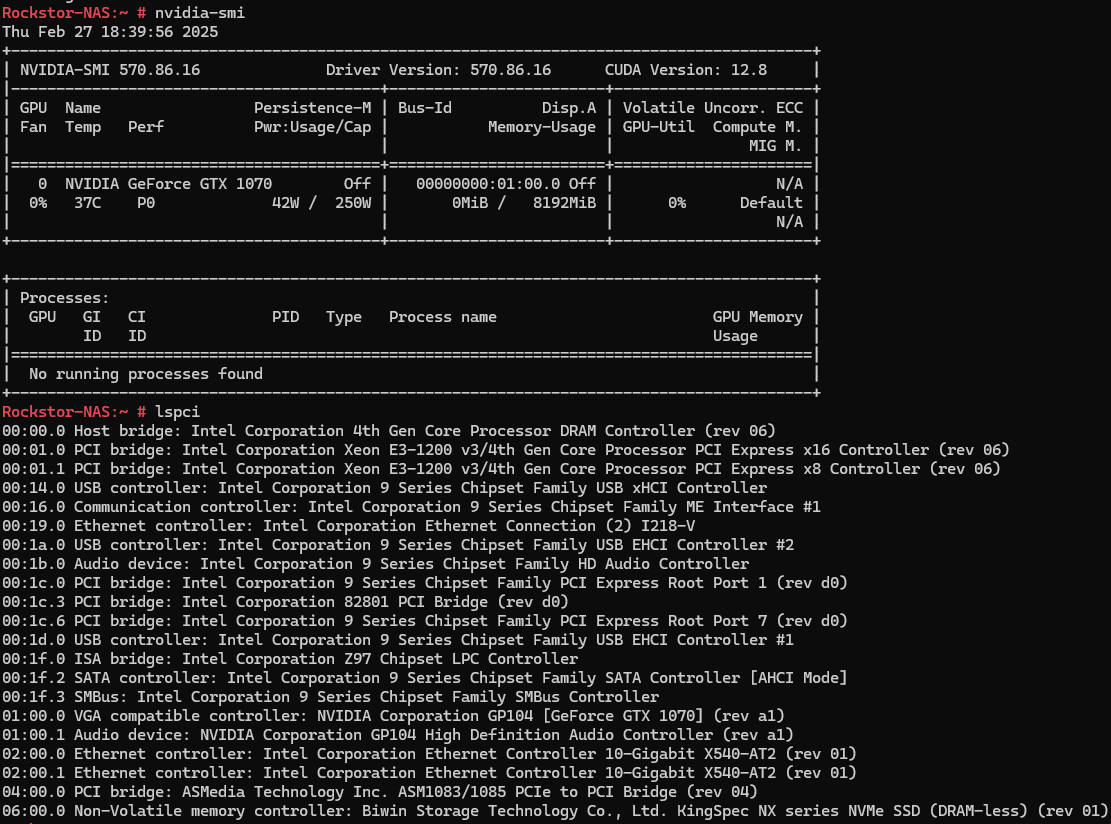
So, I have a GTX 1070Ti installed on the Rockstor_NAS, nvidia package and drivers are installed and nvidia-smi shows the GPU is there. lspci outputs=> 01:00.0 VGA compatible controller: NVIDIA Corporation GP104 [GeForce GTX 1070] (rev a1)
I want the Jellyfin Rockon to use this GPU for hardware acceleration for video transcoding. While installing Jellyfin Rockon, one of the install parameters were VAAPI Device where I was asked to path to hardware transcoding device. Not sure what this will be for my case and if I need to install jellyfin-ffmpeg7 as shown here. Any advice on what to put as VAAPI Device for Jellyfin Rockon will be appreciated.
I can report back on this now. The new Rockon Netdata (test) works the same as the Netdata (official), the same number of sensors are detected and smartctl are not available and cant be seen on the dashboard. The disks dont report their S.M.A.R.T parameters to Netdata or Netdata cant access it.
I have read through the links you have posted and did as follows:
smartctl sensors.If this is the case, let me know if I can try this and how to go about running Netdata (test) in privileged mode.
I’m fresh out of ideas on that one.
Take a look at what linuxserver.io has to say, which is the underlying image for this rockon:
So, it should be possible with some additional step (easiest will be to spin up the nvidia container outside of Rockstor, since there is currently no Rockon definition for it. If that works, and you share your experience then we can think about possibly adding this as a standalone Rockon.
There also was a conversation on the forum a couple of years ago that, involved essentially creating a custom Rockon (based on the existing jellyfin) with a couple of additional parameters added in.
As for the Netdata challenge. Let’s try to add SYS_ADMIN to the definition, like this:
{
    "Netdata (Test)": {
        "containers": {
            "netdata_test": {
                "image": "netdata/netdata",
                "launch_order": 1,
                "opts": [
                    [
                        "--cap-add=SYS_ADMIN",
                        ""
                    ],
                    [
                        "--cap-add=SYS_PTRACE",
                        ""
                    ],
                    [
                        "--cap-add=SYS_RAWIO",
                        ""
                    ],
                    [
                        "--security-opt",
                        "apparmor=unconfined"
                    ],
                    [
                        "--net=host",
                        ""
                    ],
                    [
                        "-v",
                        "/var/run/docker.sock:/var/run/docker.sock"
                    ],
                    [
                        "-v",
                        "/proc:/host/proc:ro"
                    ],
                    [
                        "-v",
                        "/sys:/host/sys:ro"
                    ],
                    [
                        "-v",
                        "/etc/os-release:/etc/os-release:ro"
                    ]
                ],
                "ports": {
                    "19999": {
                        "description": "Port used to access the webUI port. MUST be 19999.",
                        "host_default": 19999,
                        "label": "webUI port",
                        "ui": true
                    }
                },
                "environment": {
                    "PGID": {
                        "description": "GID of the 'docker' group. See System - Identity - Groups in Rockstor's UI to find it.",
                        "label": "PGID",
                        "index": 1,
                        "default": 472
                    }
                }
            }
        },
        "description": "Netdata is a scalable, distributed, real-time, performance and health monitoring solution for Linux, FreeBSD and MacOS.<p>Out of the box, it collects 1k to 5k metrics per server per second. It is the corresponding of running top, vmstat, iostat, iotop, sar, systemd-cgtop and a dozen more console tools in parallel. netdata is very efficient in this: the daemon needs just 1% to 3% cpu of a single core.</p><p>Based on the official docker image: <a href='https://hub.docker.com/r/netdata/netdata' target='_blank'>https://hub.docker.com/r/netdata/netdata</a>, available for amd64 and arm64 architecture.</p>",
        "icon": "https://github.com/firehol/netdata/blob/master/web/images/seo-performance-64.png",
        "more_info": "See <a href='https://learn.netdata.cloud/' target='_blank'>https://learn.netdata.cloud/</a> for more info.",
        "website": "https://www.netdata.cloud/",
        "ui": {
            "slug": ""
        },
        "version": "1.0t"
    }
}
If this works, great. If not, there might be one more option that can be added (the actual --privileged flag. Maybe @Flox who set up the original Rockon definition has some opinion on this, because I believe, he tried to define the Rockon so it would have the minimal required access for security purposes. Adding parameters like --priviliged or the SYS_ADMIN capability gives the docker container quite a bit of unrestricted access to the Rockstor host.
But, if you can try it out, then at least gets us a step closer to why smartctl is being so prickly vis-a-vis the docker container.
EDIT: looking at this link, I think the above is not going to make it better, but a different approach has to be taken:
https://learn.netdata.cloud/docs/collecting-metrics/hardware-devices-and-sensors/s.m.a.r.t.
Please try it anyway, as the alternative might require a mapping of each hard drive device you have
I tested Netdata using the SYS_ADMIN but nothing changed> S.M.A.R.T charts still NOT available in Netdata and smartctl doesnt show up in Netdata WebUI.
I have read through the netdata link you posted and as looking at the section docker-compose.yml So, does it mean that we need to add these lines to the Netdata_test.json that we are testing? The syntax is different in the Netdata page from how the definitions you have given above. Can you please teach me how to add the devices parameter to the Netdata_test.json definition. From what I can understand, the test definition already has the capability add SYS_PTRACE, SYS_ADMIN, SYS_RAWIO Netdata’s page adds # smartctl to SYS_RAWIO. Does the # indicate a comment in the code or is it referencing smartctl module to be accessed by the container?
Also, I’m trying to learn how to make and edit docker definitions, so if I wanted to ask about the syntax to use for adding 6 of my devices (sda,sdb,sdc,sdd,sde,sdf). I tried making a definition to add the mapping of each disk. Maybe you could have a look at it below.
{
    "Netdata (Test)": {
        "containers": {
            "netdata_test": {
                "image": "netdata/netdata",
                "launch_order": 1,
                "opts": [
                    [
                        "--cap-add=SYS_ADMIN",
                        ""
                    ],
                    [
                        "--cap-add=SYS_PTRACE",
                        ""
                    ],
                    [
                        "--cap-add=SYS_RAWIO",
                        ""
                    ],
                    [
                        "--device= /dev/sda:/dev/sda",
                        ""
                    ],
                    [
                        "--device= /dev/sdb:/dev/sdb",
                        ""
                    ],
                    [
                        "--device= /dev/sdc:/dev/sdc",
                        ""
                    ],
                    [
                        "--device= /dev/sdd:/dev/sdd",
                        ""
                    ],
                    [
                        "--device= /dev/sde:/dev/sde",
                        ""
                    ],
                    [
                        "--device= /dev/sdf:/dev/sdf",
                        ""
                    ],
                    [
                        "--security-opt",
                        "apparmor=unconfined"
                    ],
                    [
                        "--net=host",
                        ""
                    ],
                    [
                        "-v",
                        "/var/run/docker.sock:/var/run/docker.sock"
                    ],
                    [
                        "-v",
                        "/proc:/host/proc:ro"
                    ],
                    [
                        "-v",
                        "/sys:/host/sys:ro"
                    ],
                    [
                        "-v",
                        "/etc/os-release:/etc/os-release:ro"
                    ]
                ],
                "ports": {
                    "19999": {
                        "description": "Port used to access the webUI port. MUST be 19999.",
                        "host_default": 19999,
                        "label": "webUI port",
                        "ui": true
                    }
                },
                "environment": {
                    "PGID": {
                        "description": "GID of the 'docker' group. See System - Identity - Groups in Rockstor's UI to find it.",
                        "label": "PGID",
                        "index": 1,
                        "default": 472
                    }
                }
            }
        },
        "description": "Netdata is a scalable, distributed, real-time, performance and health monitoring solution for Linux, FreeBSD and MacOS.<p>Out of the box, it collects 1k to 5k metrics per server per second. It is the corresponding of running top, vmstat, iostat, iotop, sar, systemd-cgtop and a dozen more console tools in parallel. netdata is very efficient in this: the daemon needs just 1% to 3% cpu of a single core.</p><p>Based on the official docker image: <a href='https://hub.docker.com/r/netdata/netdata' target='_blank'>https://hub.docker.com/r/netdata/netdata</a>, available for amd64 and arm64 architecture.</p>",
        "icon": "https://github.com/firehol/netdata/blob/master/web/images/seo-performance-64.png",
        "more_info": "See <a href='https://learn.netdata.cloud/' target='_blank'>https://learn.netdata.cloud/</a> for more info.",
        "website": "https://www.netdata.cloud/",
        "ui": {
            "slug": ""
        },
        "version": "1.0t"
    }
}